Visualizing Expressive Performance in Tempo-Loudness Space
160 likes | 297 Views
This paper explores a novel method of visualizing expressive music performance by analyzing and correlating tempo and loudness in a two-dimensional space. Conducted by Jorg Langner and Werner Goebl, it employs data gathering techniques involving MIDI and audio recording to capture performances of various pianists on pieces by Chopin and Schubert. The study aims to determine the validity of the "faster-louder, slower-softer" hypothesis while providing insights into how musicians can better understand expressive dynamics in their performances.

Visualizing Expressive Performance in Tempo-Loudness Space
E N D
Presentation Transcript
Paper by JorgLangner and Werner Goebl Visualizing Expressive Performance in Tempo-Loudness Space Presented by VinothKulaveerasingam QMUL ELE021/ELED021/ELEM021 • 5 Mar 2012
Visualizing Expressive Performance in Tempo-Loudness Space • What is the aim? • How is it done? • How is it tested?
Visualizing Expressive Performance in Tempo-Loudness Space • Data gathering and Processing: • Method to take the reading • Data Reduction • Timing • Loudness
Visualizing Expressive Performance in Tempo-Loudness Space • Method to take the reading: • Special recording • Midi (Musical Instrument Digital Interface), It is a system which records music. • Audio recording (AR) • Original piece of music. • Data Reduction: • Windowing (smoothed) • Take section of music (in this case very close to one bar of played music), smoothed using the Gaussian window.
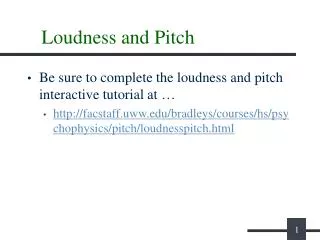
Visualizing Expressive Performance in Tempo-Loudness Space • Timing: • Special recording • Midi has a built onset recognizer. • AR: • Interactive software tool for automatic beat detection. • Detect as many onset as possible then compute the beat. • The beat can be corrected manually. • Loudness: • Zwicker’s loudness model • Measured in sones.
Visualizing Expressive Performance in Tempo-Loudness Space • Display: • After all the data has been gathered, it is been is played into a two dimension space of tempo (on the x axis) and loudness (on the y axis):
Visualizing Expressive Performance in Tempo-Loudness Space • Case Study 1 : Chopin’s E-Major Etude • 3 samples of music • Pianist 9 • Pianist 18 • Maurizio Pollini • The first two pianists (Pianist 9 and 18) has been asked to play until bar 21 of the “Chopin’ s Etude” on a Bosendorfer SE290 • The aim is to see the correlation between Tempo and Loudness in a visual way.
Visualizing Expressive Performance in Tempo-Loudness Space • Pianist 9:
Visualizing Expressive Performance in Tempo-Loudness Space • Pianist 18:
Visualizing Expressive Performance in Tempo-Loudness Space • Maurizio Pollini:
Visualizing Expressive Performance in Tempo-Loudness Space • Case Study 2 : Schubert’s G-Flat-Major Impromptu • 2 samples of music • Alfred Brendel (1997) • Todd Hybrid Model • The aim of this study is to see if Neil Todd’ s model about Tempo and Loudness is true. He stated that : “The faster the louder, slower the softer”
Visualizing Expressive Performance in Tempo-Loudness Space • Comparison of the two samples:
Visualizing Expressive Performance in Tempo-Loudness Space • Analysis of each sample: • Alfred Brendel (1997) • Todd Hybrid Model • It is not perfect “faster-louder” model. • Different parameter for timing and intensity were chosen. • The loudness unit is in sone. • Comparison: • Difference is huge.
Visualizing Expressive Performance in Tempo-Loudness Space • Analysis of the experiment: • Increase in tempo then loudness • Counter clockwise movement of the Tempo-loudness graph • To be proven by future experiments: • Increase loudness at maximum tempo • Decrease tempo at maximum loudness • Decrease loudness at minimum tempo • Increase tempo at loudness minimum
Visualizing Expressive Performance in Tempo-Loudness Space • Future: • Many future application • Help musician to understand better. • Can be used to teach music
Source • Langner J. & Goebl W. (2003). Visualizing Expressive Performance in Tempo-Loudness Space. Computer Music Journal, 27(4): 69-83.