Download
1 / 19
190 likes | 351 Views
The Floods of 2010 and beyond…. The biggest disaster in the history of Pakistan. In July 2010, floods in Pakistan affected more than 20m people. At one point, approximately one-fifth of Pakistan’s total land area was under water.

E N D
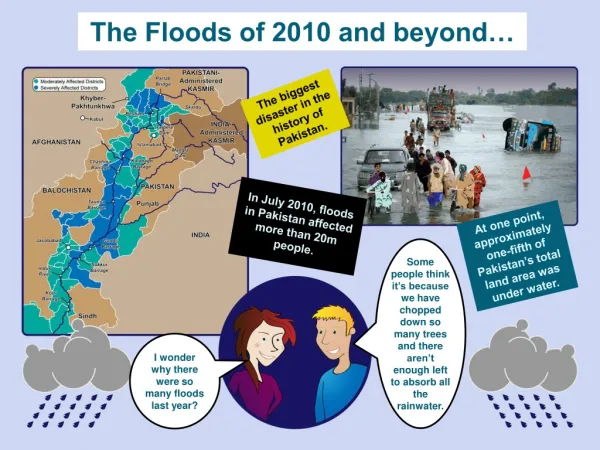
The Floods of 2010 and beyond… The biggest disaster in the history of Pakistan. In July 2010, floods in Pakistan affected more than 20m people. At one point, approximately one-fifth of Pakistan’s total land area was under water. Some people think it’s because we have chopped down so many trees and there aren’t enough left to absorb all the rainwater. I wonder why there were so many floods last year?
The floods in Victoria began in September… ...and they are still happening! Hundreds of households remain under threat with some of Victoria's biggest rivers breaking their banks. ... A wall of water like an inland tsunami hit Queensland! Thousands of people evacuated their homes. The worst floods to hit Australia in 15 years have caused damage exceeding $20 million.
Happenings... Lots of snakes, some deadly, have been swimming into people’s homes! Many people have had to be rescued by helicopter. Branches are proving useful transport for frogs! Bull shark spotted in the flood waters near Brisbane! Some koala bears climbed to the tops of trees, people have been rescuing them. Kangaroos have been able to swim to safety.
Floods around the world in 2010 Singapore Malaysia Estonia Brazil Romania Balkans Indonesia China Australia Uganda Sri Lanka India The US Can you find the flooded countries? Thailand Albania
It’s in the News! Teacher’s guide In 2010 there were many floods in different countries around the world. The two that hit the headlines as major disasters, with much property and land ruined and many people killed, were in Pakistan and Australia. These countries continue to be in the news, the first because of the problems after the floods and the second because the floods are still happening, not to mention the recent devastation in Queensland caused by cyclone Yasi. In these slides there are links to geography as we provide ideas for exploring the different countries where these floods occurred, and also some links to science. They give opportunities for work on a variety of mathematical concepts including number, measurement and data handling. … continued on the next slide
… continued Before you use the slides you might find it helpful to look at the following websites for further information: NASA (Pakistan floods): NASA Video clips (Pakistan floods): Heinrich Böll Foundation Herald Sun (Australian floods): Herald Sun Video clips from Google (Australian floods): Google Guardian.co.uk (Australian floods): Guardian Wikipedia (links to floods in other countries): Wikipedia As this resource was written a few weeks before publication, it would be worth looking for the most up-to-date information about what is happening now. … continued on the next slide
… continued There is so much information about these floods and so many mathematical links that it is impossible to cover everything, so here are just a few ideas to get you started!
1st spread: The Floods of 2010 ● Ask the children if they can remember any of the floods from last year and make a list of those that they say. You could use this as an opportunity to practice single criteria Venn and Carroll diagrams: remember floods/not remember floods. ● Focus on Pakistan, do any of your children come from there? If so you could display this information in Venn and Carroll diagrams and ask them to locate the place on the map. ● Look at a map of the world and locate Pakistan. You could print out enough copies of the map on slide four to give to pairs of children. Ask them to locate the UK and Pakistan and using the scale on the map ask them to work out the approximate distance between the two places. You could ask them to draw a straight line to link the two countries and ask them to identify the countries you might fly over or cross if travelling there as the ‘crow flies’. ● You could ask them to research Pakistan and make up a fact file which includes temperatures, rainfall, time zone, currency and population. From this information, do some comparisons with the UK, for example, finding the difference in population using a counting on strategy. You could work on some currency conversions. You could ask them to make graphs of the rainfall and temperatures in the UK and Pakistan to compare. You could look at time zones and work on time e.g. if it is 4 o’clock in the morning in the UK, what time will it be in Pakistan? If it is 13:40 in the UK, what will the time be in Pakistan? ● This would be a good opportunity to link to work on direction using compass points and coordinates. ● Look at the picture of the Pakistan flood. Ask them to describe what they see. Can they estimate and then count the number of people in the picture? Why is it difficult to be exact? …continued on the next slide
1st spread: The Floods of 2010continued… ● Read the statement that approximately one fifth of Pakistan’s total land area was under water and use this as an opportunity to explore fifths. You could give the children a piece of squared paper and ask them to draw grids that are five squares by five. How many ways can they shade one fifth. You could explore fifths of different numbers and if you can find the area of Pakistan ask the children to work out how many acres or square miles or kilometres was covered. ● You could explore equivalences with one fifth and decimals and percentages, e.g. what percentage of the land was flooded, what percentage wasn’t? ● Look at the map that shows the moderately and severely affected areas. They could make a sketch of Pakistan from this and work out how much one fifth might be and shade that on their sketch. ● Focus on the fact that over 20 million people were affected by the flooding and ask the children how they might have been affected: mostly by destruction of property, livelihood and infrastructure, with a death toll of close to 2 000. Look at the number 20 million: can they imagine how many that is? You could ask them to find the populations of various towns and cities in the UK and see how many would come to a total close to this amount. You could ask them to find the population of Pakistan and work out what percentage and proportion of the people in the country were affected. You could also ask them to find out the population of the UK and work out how many would have been affected if this had happened here. ● Look at the raindrops on the slide and ask the children to estimate and then count how many they can see. Discuss different ways to count. You could draw a similar picture on the board to make arrays and use this as an opportunity to work out the number using multiplication. The children could then find different arrays to show the 40 raindrops. You could also use this to practise number pairs to 10 and 20 using one of the clouds or up to 40 using both. You could do some work on one/two /etc. more/less and also simple addition and subtraction. …continued on the next slide
1st spread: The Floods of 2010continued… ● Focus on the comments of the two children. What does your class think? The flooding followed heavy monsoon rains in the Khyber Pakhtunkhwa, Sindh, Punjab and Balochistan regions and also affected the Indus River basin. Can the children find these on the map?You could ask them to research monsoons and make a fact file of mathematical data. They could find the average amount of rain that falls during one. You could use this as an opportunity to estimate and measure capacities. Often amounts of rainfall will be measured in inches or millimetres: use this as an opportunity to find out how much this is in millilitres. ● You could ask them to research other reasons why flooding seems to be happening more regularly and link to global warming – is this having an effect? There are some interesting arguments on this. Ask them to make a mathematical fact file including facts and evidence for one of the arguments. They could present this to the class to open a debate. ● Ask them to find out what has happened in Pakistan since the floods – have people been able to rebuild their homes? Have diseases like cholera spread as a result?
2nd spread: The floods in Victoria began in September You could repeat the geography angle on this as with Pakistan: ● do any of your children come from Australia or have relatives there? If so you could display this information in Venn and Carroll diagrams ● look at a map of the world and locate Australia. Print out enough copies of the map on slide four to give to pairs of children. Ask them to locate the UK and Australia and using the scale on the map ask them to work out the approximate distance between the two places. ● you could ask them to draw a straight line to link the two countries and ask them to identify the countries and oceans you might fly over or cross if travelling there as the ‘crow flies’ ● you could ask them to research Australia and make up a fact file which includes temperatures, rainfall, time zone, currency and population. From this information, do some comparisons with the UK, for example, finding the difference in population using a counting on strategy ● you could work on some currency conversions ● you could ask them to make graphs of the rainfall and temperatures in both countries to compare ● you could look at time zones and work on time e.g. if it is 4 o’clock in the morning in the UK, what time will it be in Australia? If it is 13:40 in the UK, what time will it be in Australia? ● this would be a good opportunity to link to work on direction using compass points and coordinates. …continued on the next slide
2nd spread: The floods in Victoria began in Septembercontinued… ● They could explore the history of the country as it is relatively new and plot the significant dates on a time line. ● Explore the map: what ocean is Australia in? What other countries are nearby? Can they locate Victoria, New South Wales and Queensland? ● Ask them to try to identify the capitals of these territories. You could use the scale on the map to work out the distances between them. You could extend this to the other parts of Australia. ● They could make mathematical fact files of these capitals and use the information to compare populations, annual rainfall etc. The children could also compare the fact files for Pakistan and Australia and use them to answer questions, such as does the largest country have the largest population? ● The flooding in Victoria began in September 2010. You could ask the children to find the timeline of the floods from 2nd September to the 7th from Wikipedia and ask them to plot the journey of the rain on a map of the area (maybe cropped and copied from the map on the slide). ● In Mount Buffalo 180mm of rain fell between the 4th and 5th. In Leigh Creek 71mm fell before 7pm on the 3rd. In Ballarat 47mm fell before 9am on the 4th. You could use this information to estimate and measure amounts of water and get a feel for how much fell. You could also explore these amounts on the National Strategies ITP Measuring Cylinder and find their differences. ● The area of the flooding at one point during this disaster was the size of France and Germany. You could explore this by asking them to cut the two countries out of the map on slide three and see how much of Australia is covered. Can they work out an approximate fraction or percentage? …continued on the next slide
2nd spread: The floods in Victoria began in Septembercontinued… ● You could explore the different territories of Australia in the same way – what percentage/fraction of one is another? ● They could cut the territories out from a copy of the slide, work out approximate areas on squared paper, in square units and then order from most to least or vice versa. ● The flooding in Queensland began on Boxing Day. How long ago was that? At one point the river running through Brisbane was expected to reach a peak of 5.5m. Explore this height. You could ask the children to estimate and then measure how many of them would need to stand on each others’ shoulders to make that same height. ● They could make a scaled-down diagram to show the depth of the river at its peak and the height of themselves, and then find out how many of them would be equivalent to that measurement. ● It was said that the water was rising at 10cm per hour – how much is this in 2, 3, 4 etc. hours, 1, 2, 5, 10, 20, 30 etc. minutes? The children could make a height/time line graph to show this. You could also use this information to explore time e.g. it is now 4:20 am and the water has risen 20cm, what time will it be when the water is 10cm higher? ● It was recorded that the peak in Ipswich, which is near Brisbane, was 19m. You could do similar activities to those above for this information. Can the children – and you - visualise that amount? ● It is thought that the warm trade winds that blew around that part of the world, warmed the ocean and caused rain clouds and in turn an enormous amount of rain. The children could research this and see if it they think this is likely. They could draw diagrams to demonstrate what was happening to the water molecules. …continued on the next slide
2nd spread: The floods in Victoria began in Septembercontinued… ● You could ask the children to pretend to be reporters from the UK and plan a trip to one of the flooded areas to interview people. This could include finding flights, working out when they would need to leave home to get to the airport two hours before departure time, how long the flight is, what time they would arrive etc. They could also work on currency conversions so they could compare prices of the things they might need to buy with sterling. You could ask them to find out the cost of hiring a car, which is the best value? They could explore petrol prices and work out how much it would cost to travel various distances if the car’s tank held 40l of petrol. They could find out the different miles per litre of different makes and find the most economic. You could ask them to explore the differences in the prices of petrol per litre and/or gallons in the UK and Australia. The opportunities for this go on and on!! You could also link into literacy – report writing, creating interview questions etc. ● Discuss the information on the slide – what does it mean when its says Victoria’s rivers are breaking their banks, households remain under threat, inland tsunami, evacuating homes? Do they remember the last major tsunami? They could find out how the countries affected by that have recovered, if they have, and what help they needed to be able to do so. ● You could ask the children to research the rivers of Australia and find their lengths. They could scale these down and make them out of string – which is longest/shortest? ● Look at the picture of all the cars. Ask the children to estimate how many they can see. Can they think of a sensible way to count them? What was the difference between their estimate and the actual number counted? ● You could compare colours of car e.g. how many white cars, red cars, how many more red cars than yellow ones? How many cars are upside down? How many trucks can you see? …continued on the next slide
2nd spread: The floods in Victoria began in Septembercontinued… ● Younger children could explore this with real cars, can they match the number in particular areas of the slide? Can they make up their own picture with 5, 10, 15, 20 etc. cars? You could use their pictures to ask questions such as how many more cars to make 10, 20, 30 etc. They could paint their cars in different colours and explore the differences in the numbers of each colour.
3rd spread: Happenings… ● Together read what it says about the snakes. How would they feel if they came up close to a snake? They could research the types of snake found in Australia and make mathematical fact files about each one. They could include average length, life span, number of eggs laid, how dangerous they are. ● You could repeat this for koala bears and kangaroos, asking them to find out first what type of animal they are. ● They could use all the information they find to make up a set of Trumps cards or similar and play games against each other. ● The children could make snakes of the different lengths that they found using string, wool or something similar. Would the snake be the same length if coiled – it looks shorter but is it? This would be a good way to explore conservation of length with the younger ones. ● Once the children have made their snakes they could draw scaled down drawings. It is always good to look for opportunities to scale down as it is a real life skill and great for rehearsing dividing by ten, five, two etc. and also for halving and halving again. ● Together focus on the way some people were rescued from their rooftops. They could find out about the history of the helicopter which dates back to Leonardo da Vinci (Focus On issue 20 of the primary magazine). ● What do the children think about being rescued by a helicopter – exciting, scary. You could make a list of the emotions they give you on the board, add a tally and ask them to create a pictogram, bar graph or pie chart to show these. Use their results to do some mental calculation involving finding totals and differences. …continued on the next slide
3rd spread: Happenings… continued… ● Apparently there are benefits to these floods. Can any of the children think what they might be: water prices are expected to drop dramatically, many areas have been suffering from drought and farmers appreciated an end to the dry conditions, the waters are expected to naturally flush out the mouth of the Murray River which hasn’t happened for a decade. You could have a discussion on whether these benefits are worth the cost! Do the children know what a decade is? You could explore the vocabulary around lengths of time.
4th spread: Floods Around The World 2010 ● The floods of 2010 weren’t restricted to Pakistan and Australia, there have been others of varying significance in several other parts of the world. Can the children locate the examples of the countries listed on the map? ● You could ask them to work in pairs, pick one or two of the countries and research information about their floods, ensure coverage of all countries. Use the information to compare and make up graphs and charts. They could order the countries according to the magnitude of the flooding. ● You could, of course, do some old favourites: ● give pairs of children one country to research and make up a mathematical fact file including temperature, rainfall, population, currency, time zones. For the rainfall and temperature ask them to create bar and line graphs and explore mean, range, mode and median. Use the information to compare countries ● find the distances between pairs of countries using the scale. Convert between metric and imperial units ● plan routes from country to country using compass directions ● plan a world tour of these countries, include costs, flights and other modes of transport. …continued on the next slide
4th spread: Floods Around The World 2010continued… And you could create some new favourites, exploring water and capacity: ● Borrow some identical syringes from the DT cupboard. Fill with water and ask each child to ‘draw’ one continuous water line. Measure the length of the lines. Who can draw the longest line? Why do you need to measure the lines quickly on a sunny day? ● Collect an assortment of containers. Select one to fill and pour out secretly to make a puddle in the playground. Dry the container and return to the collection. Challenge the children to find out which container held the mini flood. They could fill the containers and pour them out in different places in the playground to compare with the original flood. On a sunny day, it might be useful to draw a chalk line around the extent of the first flood. Why would that be helpful? ● Photograph each ‘flood’. Use them to order amount of water and match to the appropriate container. ● Invite children to estimate how much water is needed to fill the water tray. Children in Nursery or Reception could suggest how many bucketfuls, older children could estimate how many litres. Fill the water tray together to find the answer. Since these floods were in the news, others have happened for example in Brazil. You could do similar activities for these.


