Download
1 / 21
210 likes | 333 Views
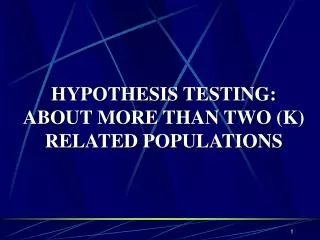
HYPOTHESIS TESTING: ABOUT MORE THAN TWO (K) RELATED POPULATIONS. Repeated Measures ANOVA. Often, one wants to administer the same test to the same subjects repeatedly over a period of time or under different circumstances.

E N D
HYPOTHESIS TESTING: ABOUT MORE THAN TWO (K)RELATED POPULATIONS
Repeated Measures ANOVA Often, one wants to administer the same test to the same subjects repeatedly over a period of time or under different circumstances. In essence, one is interested in examining differences within each subject, for example, subjects' improvement over time. Such designs are referred to as within-subjects designs or repeated measures designs.
For example, imagine that one wants to monitor the improvement of students' algebra skills over three months of instruction. A standardized algebra test is administered after one month (level 1 of the repeated measures factor), and comparable tests are administered after two months (level 2 of the repeated measures factor) and after three months (level 3 of the repeated measures factor). Thus, the repeated measures factor (Time) has three levels.
Time Subject Mean 1 j t 1 x11 x1j x1t i xi1 xij xit n Mean
Repeated measures can occure in different ways: • Repeated measures can be taken at different time points in a single group. • Repeated measures can be taken at different time points in several groups.
Example Temperatures of the forehead (in degrees Celsius) measured at 30-minute intervals in a single group of subjects are given in the table. H0:There is no difference between time periods
Example Temperatures of the forehead (in degrees Celsius) measured at 30-minute intervals in two groups of subjects are given in the table.
Three pairs of hypotheses can be tested: • Hypothesis on groups • Hypothesis on time points • Hypothesis on interaction
Cochran’s Q Test Cochran’s Q Test extends McNemar Test to examine change in a dichotomous variable (0-1) across more than two observations. It is a particularly appropriate test when subjects are used as their own controls and dichotomous outcome variable is measured across multiple time periods or under several types of conditions.
where k: # of conditions or time periods N: # of subjects Gj: The total # of 1s in the jth column Li: The total # of 1s in the ith row Post hoc tests are necessary to determine where the differences lie.
ExampleThe children in the anxiety reduction intervention groups were evaluated for the presence of certain symptom before and after the intervention. Is the clinical intervention effective in reducing the symptom? Since the pretest-posttest measure is dichotomous and the data are paired, the use of McNemar test is appropriate to answer this question.
Suppose one month after the end of the intervention program a third measurement is taken from all children. Is the proportion of children who presents the symptom (yes,no) same across all three data collection periods? Since there are now three points of data collection, the McNemar test can no longer be used. Cochran’s Q test, however, woud be appropriate. H0:the proportion of “yes” responses with regard to the presence of the symptom same across all three time periods for those children.
2(2,0.05)=5.99 <Qcal, p<0.05 Reject H0.
Friedman Test The Friedman Test extends the Wilcoxon Signed Ranks Test to include more than two time periods of data collection or conditions Where Rj: The sum of the ranks for column j N: The # of subjects k: # of time periods or conditions This statistic is distributed as a chi-square with df=k-1.
Multiple Comparisons Test Once a determination has been made that the overall Friedman test is significant, post hoc tests can be undertaken that compare the differences in average ranks for all possible pairs to determine where the differences lie. The null hypothesis of no differences in mean ranks of the pairs being examined will be rejected if absolute value of these differences is greater than a specified critical value. That is, we would reject the null hypothesis if the following condition holds true: Ri: the mean rank for time or condition i k: the number of time periods or conditions N: the number of cass
Example Suppose we had collected information concerning the 10 children’s anxiety levels not only at pretest and immediately following the anxiety reduction intervention but also just prior to the administration of the preoperative medication. What are the differences in the anxiety levels of the 10 children who took part in the intervention across the three time periods? H0: there will be no differences among the median anxiety scores at preintervention, at postintervention, and at preoperative medication for the 10 children who took part in the intervention.
2(2,0.05)=5.99 <Fr, p<0.05 Reject H0.