Download
1 / 21
210 likes | 331 Views
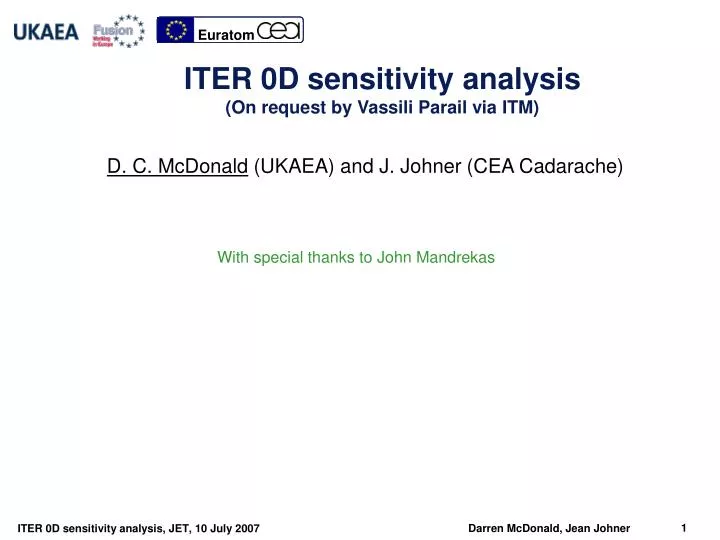
ITER 0D sensitivity analysis (On request by Vassili Parail via ITM). D. C. McDonald (UKAEA) and J. Johner (CEA Cadarache). With special thanks to John Mandrekas. Quick recall of the modelling and assumptions.

E N D
ITER 0D sensitivity analysis(On request by Vassili Parail via ITM) D. C. McDonald (UKAEA) and J. Johner (CEA Cadarache) With special thanks to John Mandrekas
Quick recall of the modelling and assumptions Study with GTBURN (J Mandrekas, Georgia Institute Tech.) [Petty et al, PoP 2004] • 0-D core thermal equilibrium equation where • fHe calculated self consistently from the condition t*He/tE= Cte = 5 where t*He=NHe/SHe • Te/Ti= Cte = 1.1 • given profiles (an= 0.01, aT= 0.966) , • Impurities : fBe=2 % ; fAr= 0.12 % NB: different from HELIOS analysis. Follows [Green et al, NF 2003] • tE = H98tE,IPB98(y,2) with H98= 1
Total line and bremsstrahlung radiation (plasma mantle + SOL + divertor) calculated from emission cross-sections • Quick recall of the modelling and assumptions • For Psep calculation (used for H mode threshold condition) is assumed (Ar injected discharges in JET) • L-H transition fit [IDM/PID/PAD/PPA (August 2004)] Recommended fit in IPB2007 Taken in POPCON plots
ITER reference scenario, Q = 10 CRONOS run, synchrotron loss computed with EXATEC Total synchrotron loss = 5.2 MW, with wall reflection coefficient = 0.6 • Synchrotron radiation from EXATEC (J. Garcia)
ITER reference inductive operation Difference in Q probably from use of fraction of line radiation in net power. In future will use aT=0.905 which gives Q=10 • Scenario 2 : Ip= 15 MA (q95 3), H98= 1, Q= 10, Pfus= 400 MW GTBURN power balance: Palpha=+80.1MW Paux=+37.5MW Pohm=+0.9MW Pbrem=-21.2MW Psync=-3.3MW Pline_core=Pl/3=5.9MW Pcond=+88.1MW Pb OK Little pb Note
ITER reference inductive operation • Scenario 2 : Ip= 15 MA (q95 3), H98= 1, Q= 10, Pfus= 400 MW I haven’t checked the divertor model in GTBURN, so am not using it. Pb Little pb OK Note
Inductive H-mode, reference confinement, full field (5.3 T, 15 MA) 11 Greenwald fGr = 0.85 bN(th) = 2 10 500 MW Scenario 2 Scenario 2 400 MW PFUS=300 MW L-H Q = 5 Psep=PLH 5.3 T / 15 MA, H98=1, tHE*/tE=5, fBe=2%, fAr=0.12%, an=0.01, aT=0.905
Inductive H-mode, full field (5.3 T, 15 MA) P>2PL-H 5.3 T / 15 MA, H98=1, tHE*/tE=5, fBe=2%, fAr=0.12%, an=0.01, aT=0.905 11 Greenwald fGr = 0.85 Qmax= 8.2 10 bN(th) = 2 500 MW 8.2 400 MW Psep= 2 PLH L-H PFUS=300 MW Q = 5
Inductive H-mode, full field (5.3 T, 15 MA) 5.3 T / 15 MA, H98=1, tHE*/tE=5, fBe=2%, fAr=0.12%, an=0.01, aT=0.905 11 Greenwald fGr = 0.85 10 bN(th) = 2 500 MW 2L-H □ P≥PL-H, fGr≤0.85: Q≤10.4 ◊P≥PL-H, fGr≤1: Q≤11 Δ P≥2PL-H, fGr≤0.85: Q≤8.2 8.2 L-H 400 MW PFUS=300 MW Q = 5
Inductive H-mode, 10% reduced field (4.77 T, 13.5 MA) 4.77 T / 13.5 MA, H98=1, tHE*/tE=5, fBe=2%, fAr=0.12%, an=0.01, aT=0.905 Greenwald 5.8 fGr = 0.85 5.7 bN(th) = 2 500 MW □ P≥PL-H, fGr≤0.85: Q≤5.7 ◊P≥PL-H, fGr≤1: Q≤5.8 Δ P≥2PL-H, fGr≤0.85: Q≤4.9 400 MW 5 PFUS=300 MW 2L-H L-H Q = 4.9
Inductive H-mode with +20% confinement, full field (5.3 T, 15 MA) q95 3, H98= 1.2
Inductive H-mode, +20% confinement, full field (5.3 T, 15 MA) 5.3 T / 15 MA, H98=1.2, tHE*/tE=5, fBe=2%, fAr=0.12%, an=0.01, aT=0.905 Greenwald fGr = 0.85 54 bN(th) = 2 2L-H 48 L-H 500 MW □ P≥PL-H, fGr≤0.85: Q≤48 ◊P≥PL-H, fGr≤1: Q≤54 Δ P≥2PL-H, fGr≤0.85: Q≤9.9 20 400 MW 9.9 PFUS=300 MW Q = 5
Inductive H-mode, +20% confinement, reduced field (4.77 T, 13.5 MA) 4.77 T / 13.5 MA, H98=1.2, tHE*/tE=5, fBe=2%, fAr=0.12%, an=0.01, aT=0.905 Greenwald fGr = 0.85 16.4 bN(th) = 2 2L-H 500 MW L-H □ P≥PL-H, fGr≤0.85: Q≤16.4 ◊P≥PL-H, fGr≤1: Q≤16.4 Δ P≥2PL-H, fGr≤0.85: Q≤6.8 400 MW 10 PFUS=300 MW 6.8 Q = 5
Inductive H-mode with regular confinement, full field, low q95 (5.3 T, 17 MA) q95 2.65, H98= 1.0
Inductive H-mode, improved current, full field (5.3 T, 17 MA) 5.3 T / 17 MA, H98=1.0, tHE*/tE=5, fBe=2%, fAr=0.12%, an=0.01, aT=0.905 Greenwald 27 bN(th) = 2 fGr = 0.85 23.4 2L-H □ P≥PL-H, fGr≤0.85: Q≤23.4 ◊P≥PL-H, fGr≤1: Q≤27 Δ P≥2PL-H, fGr≤0.85: Q≤13.6 L-H 13.6 500 MW 400 MW 10 PFUS=300 MW Q = 5
Inductive H-mode, improved current, reduced field (4.77 T, 15.3 MA) 4.77 T / 15.3 MA, H98=1.0, tHE*/tE=5, fBe=2%, fAr=0.12%, an=0.01, aT=0.905 Greenwald 11.3 bN(th) = 2 fGr = 0.85 10.8 500 MW □ P≥PL-H, fGr≤0.85: Q≤10.8 ◊P≥PL-H, fGr≤1: Q≤11.3 Δ P≥2PL-H, fGr≤0.85: Q≤7.9 10 2L-H L-H 400 MW PFUS=300 MW 7.9 Q = 5
Qmax for H98= 0.8 when PLH < Psep < 2PLH and H98= 1 when Psep > 2PLH Padd= 89.5 MW max
Summary of predicted fusion products GTBURN HELIOS - Same trends in codes. GTBURN generally shows smaller Q range for varying constraints - Confidence intervals: H=0.8-1.2 in 5.3T/15MA with 85% Gr and P>PL-H => Q=3.6-48
Power balance for GTBURN seems to give slightly different results to HELIOS. Seems to be due to the fact that GTBURN takes some line radiation from the core (≈6MW in Scenario 2 operating point) • aT= 0.905 is chosen for the reference ITER scenario 2 operating point: Q= 10, Pfus= 400 MW (magenta square) to sit exactly at ne/nGr= 0.85 • Results in bigger differences in Q, with GTBURN giving maximum Q≈11 for n=nGr in scenario 2 compared with Q≈12.3 for HELIOS (blue square). • If Psep= 2 PLH is required for good confinement, the maximum Q for H-mode inductive operation of ITER with fBe= 2 %, fAr= 0.12 %, t*HE/tE= 5 is Q(2)max 8.2 (magenta square) compared with Q(2)max 7.3 for HELIOS • Similar differences with HELIOS for other scenarios • Comments on existing work
Future plans • Complete benchmark exercise with HELIOS. Resolve reason for difference (line radiation.?) and resolve which method will be taken as standard. • Extend study to other scenarios. • Examine confidence intervals, based on those given for L-H threshold and confinement times. • Look at other confinement scalings (beta scaling) • Study density effects. Peaking [Weisen et al] and density limits [Borass et al]