Sensitivity Analysis
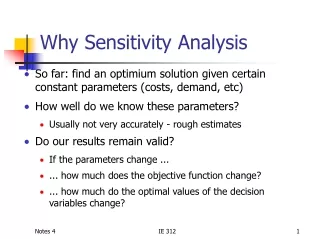
Sensitivity Analysis. A systematic way of asking “what-if” scenario questions in order to understand what outcomes could possibly occur that would effect your decision which input assumptions have the most impact on key outputs and thus your decision and should be analyzed further


Sensitivity Analysis
E N D
Presentation Transcript
Sensitivity Analysis • A systematic way of asking “what-if” scenario questions in order to understand • what outcomes could possibly occur that would effect your decision • which input assumptions have the most impact on key outputs and thus your decision and should be analyzed further • Performed by setting all inputs equal to their base values and changing one variable’s assumed value at a time
Spreadsheet Data Tables • Data Table 1 allows you to change one input variable’s value at a time and record the impact that the input assumption has on several selected key decision-making outputs. • Data Table 2 allows you to changetwo input variable values simultaneously and record the impact that the input assumptions have on one key decision-making output.
How to Set Up a Data Table 1 with Column Input • Create the table on the same worksheet where the input variable cell is shown. • The first column of the table should hold possible values for the input variable being considered. The first cell in this column should be left blank or filled with an identifying label for documentation. • The first row of the table should contain linking formulas to the key output variables for which you would like to record observed values • The table that is defined by the first column and first row is an array that will be filled in with observed values for the key output variables identified by the column heading row. • See MyLMUConnectExcel Snippit: What is the purpose of the One Variable Data Table?
Calculating the Data Table Values • Highlight the entire data table array • Go to the Data ribbon, Data Tool category, What-if Analysis submenu and select Data Tables. • Fill in the Table dialog box by entering the cell address for the input variable location into the Column Input Cell box. Click OK. • Excel will systematically place one value from the first column into the address you specified in the Table dialog box. It will then record the observed values for the output variables in the respective columns. • See the two MyLMUConnectExcel snippits: Using Excel’s Data Table Menu Command
Modifying the Data Table Array • After calculating a Data Table, a Table function will be visible inside each cell of the data table. This is an array function that may not be directly edited or partially removed. To remove the results and formulas, you must select the entire array and press delete. • The Table function in the array makes the table dynamic to new possible input values that you may want to test. If you change the numbers in the first column or a base value for another input in the model, the table will automatically update with the new observed results.
Input Variable Values • Worst Case –vs- Most Likely Case –vs- Best Case scenarios • 10%, 20%, 30% above and below the expected value • Do not put formulas in column 1 that refer directly or indirectly to the input variable cell that you will enter in the Table dialog box. This will create a circular reference and give you garbage in your table results (without showing an error message!)
Tornado Charts • Shows how sensitive one output is to all inputs in the model. This allows you to quickly identify which parameters can have a major impact on a key result. • Can be easily created using RSPE. Highlight the output cell and select the RSPE ribbon, Parameters, Identify option. • Input values are tested for a specified % change option.
Spider Diagrams • Line graphs which allow you to visually compare how different input variables impact a key output variable. • The lines with the steepest slopes can be identified as the input assumptions which are most likely to impact the final decision. • You should examine the range over which the input assumptions were tested to validate the appropriateness of the lines shown.