Download
1 / 28
280 likes | 429 Views
Building the Business Case for Rapid, Flexible Build-to-Order. The Objective: To Demonstrate. Why Demand-Based Rapid Flexible Build-to-Order is the appropriate operating strategy for a majority of 21 st Century North American Manufacturers. Keep Doing What You’re Doing.

E N D
Building the Business Case for Rapid, Flexible Build-to-Order
The Objective: To Demonstrate.... Why Demand-Based Rapid FlexibleBuild-to-Order is the appropriate operating strategy for a majority of 21st Century North American Manufacturers. Keep Doing What You’re Doing... & You’ll Keep Getting the Same Results & that won’t be acceptable much longer!
What is Demand-based Rapid Flexible Build-to-Order ? A shared operating methodology to achieve Flexibility throughout the supply chain with mutual goals of meeting “CUSTOMER” expectations at the lowest possible cost in the fastest possible time. • Customer-centric Organizational Strategy focused on improving the Customer experience • A Collaborative Supply Chain “Matrix” that Shares common goals of Speed, Cost, and Quality through Synchronous Processes • An Operating philosophy that Leverages Proximity-to-Market Through Fast Response to Customer Demand
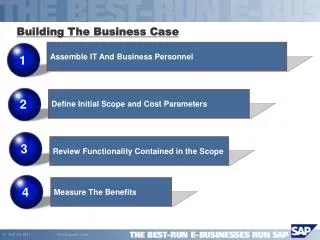
Operational Goals Responsive to Customer Needs Being a Reliable Supplier Lowering Costs Implementation Characteristics Predictable Flexible Simple (Disciplined, Process-driven, Systematic) A Basic Perspective of Competitiveness Shared by the Visionary and The Desperate* * Over 550 Annual Reports, 1999-2005
The Take Away: What’s It Worth to You, in Operational Terms? • To lower your Inventory 50-70%, • To increase Throughput 10-15%, • To reduce Scrap 10-15%, • To grow Market Share 10-15%, • To reduce Cash-to-Cash cycle 15-20%, and • To be 99+% On-time and Reliable to your Customer?
Lean’s Not Enough • “Of 600 companies that have employed lean techniques for at least 10 years, 63% have stalled in reducing inventory, a straightforward marker of lean success.”* • Toyota, GE, Toro, Snap-on Tools, Blount International, Twin Disc, A.O.Smith, Amada, Fanuc, Okuma, etc. • issue *”Lean Is as Lean Does” by Richard J. Schonberger • Manufacturing Engineering Magazine, June 2002
How North America is being Affected • Globalization and Outsourcing • Mass Customization • Supply Chain integration helps; Low cost competition hurts. • China (specifically) • Chinese OEMs in U.S. help; Excess Chinese capacity hurts. • Flexibility helps; Assembly Lines & Takt Times hurt. It depends on how well (and how soon) N.A. OEMs and Suppliers can get their costs down dramatically while increasing their ability to respond to customers faster.
Manufacturing Evolution 1970-Present Flexibility Manufacturing Concept Mass Customization Lean costs Flow Efficiency Stand alone inventory Quality Concept & Level 6σ @ 6 sigma Supply Chain-wide Information Focus Demand-based (Flexible) Std Costs Machine efficiency High inventory was good Strategic Flexibility Lean Enterprise 6σ @ 4 sigma Collaborative & Transparent Supply Chain Synchronization Integrated inventory JIT MRP & MRP II TQM @ 2 sigma Work Center & Mat’l release Mass Production PAST FUTURE SPC @ 1 sigma . Work Center Optimization High Inventory was manageable 1970 1980 1990 2000
California’s Offshore Options Source: U.S. Bureau of Labor Statistics, Mckinsey analysis To stay onshore, increase flexibility in responding to customers, reduce importance of factor costs¹ High Customer Service Intensive Industries Food Production Computer/Electronics³ Well positioned to keep manufacturing onshore Fashion/Apparel Medical Devices Designer furniture Up for grabs- may keep onshore by increasing flexibility and reducing cost. May move offshore if no action taken Aerospace Automotive Degree of Flexibility in Meeting Customer Needs² Basic furniture Leather products Machinery Ship/boat building Semiconductors Textiles Manufacturing frequently moved offshore Plastics Metals Capital Intensive Industries Labor Intensive Industries Low High Importance of Factor Costs (e.g. Capital, Labor, purchased Material) • Industries where offshoring is not under consideration include those based on local raw materials (eg. Wood, petroleum) and those related to national security • In terms of quantity/size of orders, delivery speed, component specifications, design customization among other factors • Excludes Semiconductors 1 2 3
Mass Customization: Experiences in Markets of One To-Order “Market of One” “Match this Tie and put my initials in the head rests.” “Assembled” Options “Give me a Blue one with Option Package # 3.” “Standard” Options “Give me that Blue one.” Single Form Product/Service To Stock “Any Color as long as it’s Black”
Turning the Challenge of Offshore Competition into Opportunity! • Proximity-to-Market can offset lower labor rates, higher freight costs, and longer lead times…provided Flexibility is leveraged along with lower overall costs. • Especially if*: • labor content is less than 25% • The ratio of transportation costs to total product costs is affected by shipping “packaging space” • Lead-time and scheduling translate into elevated levels of Inventory or obsolescence • Orders are subject to engineering changes or change orders • Technology-driven processes requiring significant oversight *Booz-Allen Hamilton: The China Syndrome, Jan., 2005
Through 2006, manufacturers that implement demand-based process change will experience 50 percent more customer loyalty than those that do not (0.8 probability). Source: Gartner Dataquest
Through 2006, manufacturers that implement synchronized processes aimed at improving the customer experience will drive at least 30 percent more in revenue from installed customers than those that do not (0.7 probability). Source: Gartner Dataquest
Through 2006, enterprises embracing Demand-based manufacturing will become less reliant on forecasting as a driver of daily production activity (0.8 probability). Source: Gartner Dataquest
Forecast: Even Less Reliable # 100 % N Possible Permutations Forecast Accuracy Pre-Engineered Combinations 0 0 Number of End-Item Components As end-item variability increases, the ability to forecast decreases.
Traditional Demand-Based Demand-Based Changes the Rules Driven by Intellectual Assets and Customer Demands Driven by Internal R&D Design Driven by Customer Demand Forecast Driven by History and Current Demand Plan Customer-Order-Based MRP-Based Relationship-Based With Strategic Matrix of Vendors Reorder Point With Many Vendors Source Order-Driven Noncore Outsourcing Make Forecast-Driven Internal Operations Service Strategic Program Focused on Customer Experience Tactical Program
What a Demand Based Focus means to Suppliers Build Inventory Build Flexibility Two Response Alternatives Buffers the effects of reduced planning visibility. Covers up de-coupled processes. Offsets quality and delivery issues. Increases costs as selling price reduces (will lower profitability). Buffers the effects of reduced planning visibility Increases agility in synchronizing and sequencing processes Focuses continuous improvement efforts using bottleneck mgt. Reduces costs as selling price reduces (could maintain or increase profitability). The Customer-Centric Alternatives
Tier 1 Supply Chain You Tier 2 Customer R & D Organizational Systems Functional Manufacturing Marketing Mix Volume Expansion Plant Modifications New product The Rapid Flexible Business Model Rapid Flexible Build-to-Order is an Integrated Response to Mass Customization Operational Shop Floor Routing Labor Material Handling Individual Machine
Key Process Transformations Required Customer-Facing Internal Supplier-Facing Service Product Repetitive Outsource Current Style • Maximize value-added services • Focus on core competencies • Leverage existing product knowledge • Develop pre-engineered offerings • Add sub-assemblies support • Optimize manufacturing with lean • Determine core capability • Source components from qualified suppliers • Collaborate Engineer- to-Order • Develop programs (e.g., VMI) to enhance customer service • Determine core capability • Source components from qualified suppliers • Collaborate • Shift inventory from FG to collaborative WIP • Assemble-to-order based on product configurations • Optimize manufacturing with lean • Trigger production from customer signal Make-to- Stock
Traditional Internal Either long lead times, high costs, or both High level of Manufacturing Flexibility Low Volume, Highly Engineered Products High Inventory Levels to maintain Flexibility Costs higher than Build-to-Forecast Rapid Flexible Throughout Supply Chain Short lead times High Level of Organizational, Operational, and Manufacturing Flexibility Both High Volume Standard Products along with Highly Engineered, Low Volume Low Levels of Inventory because of Supply Chain Collaboration Costs lower than Build-to-Forecast Traditional Build-to-Order and Rapid Flexible Build-to-Order are not necessarily the same Thing!
Isn’t Build-to-Order just for Job Shops? • The Automotive Industry • Toyota with a 20 day OTD • Nissan targeting 14 Days • BMW working toward 12 Days • Best Practices in the Auto industry is 10 Days • Metal Fabricators • Building Construction 10 Day OTD • Utilities, Telecom with 7 Day OTD (down from 45) • Domestic Furniture Industry • Berline/Bencraft Furniture delivering in 20 Days • Lane Furniture has reduced delivery to 30 Days from 6 to 8 weeks • Rowe Furniture targeting an industry record of 10 days for customized sofas and loveseats
A View of the Domestic Automotive Industry • A Classic Push Industry • Forecast Driven • Strong OEMs, weaker supplier and customer base • Traditional Silo functional structure with regards to the supply chain. Too many decoupled processes An Industry in Transition • Profit Challenged • Cost pressures from low cost labor countries. Today China, Thailand and Indonesia. Tomorrow Myanmar, Bangladesh, and Afghanistan • Costs estimated to be more than 20% too high
The Lean Automotive Supply Chain? • 40+ days of OTD time • $59B+ excess costs ($4000 average per vehicle) • $30B-$50B incentives and discounts (Over $3000 per vehicle) • 200+ day cash-to-cash cycle from Tier II to end consumer • 38% of parts suppliers at bankruptcy risk An Industry in Transition $120+ Billion Total
14-Day Challenges Suppliers • Suppliers don’t know how to support it and reduce costs at the same time. • Flexibility through Inventory costs money • Support has to come from buffer inventory • As more models are added, buffers get bigger • Flexibility through Douki Seisan requires higher level of collaboration • Collaboration depends on trust • Flexibility is best achieved through agility • Takt time discipline can interfere with flexibility and agility • Agility requires short reaction capability • Forecasting is an unreliable method to provide early warning signals The Supplier’s Dilemma
$ $ Service: shorter deliveries and better ship-on-time performance Inventory: less purchased, work-in-process and finished inventories Flexibility: faster response to changing market conditions Productivity: higher labor utilization and less non-value-adding costs Revenues Operating Costs Capital Employed Profit Cash Flow ROCE The Value Proposition of Rapid Flexible Build-to-Order in Real Terms Competitors with the shortest supply cycle usually dominate their markets because they have the advantage of flexibility, responsiveness and low cost. Let’s compare two competitors with similar products and value-adding processes, but different supply cycles; the one with the shorter cycle has a distinct competitive and financial advantage. The Bottom Line
Modular products where possible Considerations for Rapid Flexible Build-to-Order Design Forecast • Only used for long-term planning The Build-to-Order Future State Plan • Less MRP, more context-driven Source • Fewer, more strategic suppliers. More integration Make • Focus on core, make it lean Service • Speed and Cost are the differentiators
A Rapid Flexible Build-to-Order, Proximity-to-Market, Operating strategy Delivers What Customers Want! “The measure of the executive is the ability to get the right things done” Peter Drucker; The Effective Executive
John P. Collins, CFPIM jcollins@ssi-spm.com Building the Business Case for Rapid Flexible Build-to-Order, Session G-2 Please return your completed session survey to the room monitor or the collection boxes near the exit.