Download
1 / 17
170 likes | 320 Views
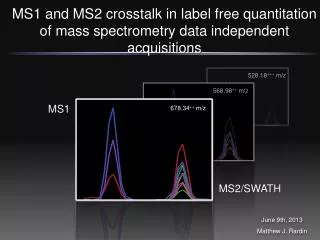
MS1 and MS2 crosstalk in label free quantitation of mass spectrometry data independent acquisitions. 528.18 +++ m/z. 568.98 ++ m/z. MS1. 678.34 ++ m/z. MS2/SWATH. June 9th, 2013 Matthew J. Rardin. SIRT3 regulated mitochondrial lysine acetylation. Cytosol. OM. IMS. IM. Matrix.

E N D
MS1 and MS2 crosstalk in label free quantitation of mass spectrometry data independent acquisitions 528.18+++ m/z 568.98++ m/z MS1 678.34++ m/z MS2/SWATH June 9th, 2013 Matthew J. Rardin
SIRT3 regulated mitochondrial lysine acetylation Cytosol OM IMS IM Matrix • Type 2 Diabetes • Metabolic syndromes • High/low-fat diet • Aging • Cancer PNAS 2013 110 (16), 6601-6606.
Strategy for identification and quantitation of the SIRT3 regulated acetylomein mouse liver mitochondria • Mitochondria were purified from 5WT and 5KO mice by differential centrifugation and normalized to total protein • Perform a trypsin digest with two replicates per mitochondrial sample to control for process variability • Spike-in acetyl standardLVSSVSDLP(acK)Ras a sample process loading control • Two polyclonal antibody combination for enrichment of lysine acetylated peptides • Two injection replicates per sample were ran on the Triple TOF 5600 • Label free “relative” quantitation using MS1 Filtering • Published spectral library information in Panorama PNAS 2013 110 (16), 6601-6606.
Skyline MS1 Filtering A quantitative tool for discovery proteomics experiments • Follow a few peptide analytes to >3000 peptides • Label-free • Skyline interface and tools • MS platform/manufacturer independent (QqTOF, FT and ITs)* Samples (1, 2, 3,… N) Mass Spectrometer Peptide Search Engine(s) Redundant Spectral Library Peptide Ion Chromatograms (raw data) Peak Integration Relative Quantitation Mol Cell Proteomics 2012 11: 202-214.
Label free quantitation using MS1 Filtering in Skyline Peak Integration of the peptide ELQHHVKAcSVTAPYK+++ KO1 KO2 WT1 WT2 PNAS 2013 110 (16), 6601-6606.
Peak area replicates of ACSM1 K534 Peak Integration Peak Area Replicate View KO1 KO2 M+2 M+1 WT1 WT2 M PNAS 2013 110 (16), 6601-6606.
Label free quantitation of KAcpeptides in SIRT3-/- A • Quantitation of 2017 KAc sites • Coefficient of variation of the • peptide standard was 26% across 40 replicates • Peptide area is normalized to spiked-in peptide standard • Identified 266 sites on 136 proteins with greater than 2-fold increase in SIRT3-/- (p-value<0.01) • Majority of sites were unchanged in the KO • Quantitation of peptides from mitochondrial lysates showed no significant increase in protein expression • >2x & p-value < 0.01 • <2x or p-value > 0.01 B OTC – Urea cycle PNAS 2013 110 (16), 6601-6606.
Targeted quantitation of acetyl peptides by Selected Reaction Monitoring (SRM) mass spectrometry • Data collected on a 5500 QTRAP • Spiked in 25 fmol of a heavy labeled synthetic peptide corresponding to peptides of interest • SRM demonstrates similar results to MS1 Filtering p-value < 0.05*, 0.01** PNAS 2013 110 (16), 6601-6606.
Adding MS1 quantitation to a DIA MS2 (SWATH) acquisition • What is the relationship between MS1 and MS2 quantitation in a DIA acquisition? • -MS1 scan is acquired between each SWATH cycle • Is there value in combining MS1 analysis to SWATH MS2 data? • Are there cases when one method (MS1 or MS2) provides more accurate data than otherWhen is one data set compromised?
MS1 Filtering vs SWATH in Simple and Complex Matrix Std. Concentration Curve 4 amol – 25 fmol A B Simple Matrix - 25fmol b-gal Complex Matrix – 300 ng digest SWATH - YAPVAKAcDLASR SWATH - MVQKAcSLAR Slope 0.87 Slope 1.03 MS1 - YAPVAKAcDLASR MS1 - MVQKAcSLAR Slope 1.0 Slope 0.51
Inferences increase in the MS1 Signal with sample complexity * * Simple Matrix – 25 fmolb-gal Complex Matrix – 300 ng protein digest * - Interference
Quantitative comparison of 250 peptides at a fixed ratio using MS1 and SWATH • 6 technical replicates were acquired using either 100ng or 300ng of a protein digest • The frequency of the peptide ratios in MS2 was tighter than MS1 • The average ratio in the MS2 was closer to the actual ratio; 3.11 vs 2.83 in the MS1 Filtering • Sum of fragment ions in MS2 dramatically improves the distribution of ratios and p-values • SWATH performed better then MS1 Filtering, but not as dramatically as we expected
Inferences in the MS2 Signal A. Dynamic Interference y8-interference SWATH MS2 expected rep1 rep2 rep3 MS1 expected rep1 rep2 rep3 B. Stable Interference C. Weak MS2 signal y6-interference SWATH MS2 SWATH MS2 expected rep1 expected rep1 MS1 MS1 expected rep1 expected rep1
Reducing interferences in the MS2 scan during a SWATH DIA SWATH 25 m/z MS1 scan – 250 msec MS2 scan – 125 msec SWATH 10 m/z MS1 scan – 250 msec MS2 scan – 50 msec
SUMMARY • During a SWATH DIA the MS1 scan is still acquired on the Triple TOF 5600. • In Skyline, both the MS1 and MS2 scans can be extracted and used for quantification of peptide analytes • In a simple matrix the MS1 scan appears to have greater sensitivity then the MS2 scan. However in more complex samples the MS2 scan outperforms the MS1 scan. • The MS1 scan provides useful information and can be used as a secondary quantitation strategy • Use of both scans allow for screening and identifying various types of interferences • Reduction of the SWATH window in a complex sample reduces interferences without loss of sensitivity in the MS2 scan
Acknowledgements Laboratory of Bradford W. Gibson Birgit Schilling – MOA 3:50pm MS1 Filtering for quantifying lysine acetylation in E. coli. Alexandria D’Souza – TP521 External tool development in Skyline Jason Held – WP555 Quantifying cysteine oxidation using MS1 Filtering and SWATH Anna Zawadzka – THOD 8:50am Breast cancer biomarker study using MS1 Filtering M M+1 M+2 y7 y6 y8 y5 b5 b4 University of Washington Michael J. MacCoss Brendan MacLean