Download
1 / 50
510 likes | 687 Views
Communication Network. Steven Low CS & EE Depts, Caltech Oct 1, 2001. Outline. Information revolution 3 circles of impact Network growth 4 driving forces. Technological Revolutions. 1780s - 1840s Steam power 1840s - 1890s Railway 1890s - 1930s Electricity 1930s - 1980s Car

E N D
Communication Network Steven Low CS & EE Depts, Caltech Oct 1, 2001
Outline • Information revolution • 3 circles of impact • Network growth • 4 driving forces
Technological Revolutions 1780s - 1840s Steam power 1840s - 1890s Railway 1890s - 1930s Electricity 1930s - 1980s Car 1980s - Information Technology (IT) IT : processing, storage & communication of info (flight reservation, ID database, telephone, ...)
Core IT IT-using Industries Economic & Social life Circles of Impact Core IT: computer, communication technologies IT-using Industries: corporations, governments, institutions Economic & Social life: how we live, work, play & interact
1st Circle: Core IT Moore’s Law Computing power doubles every 18 months Computing power 1972 - 97: 1,000 times log scale Computing cost: -30%/yr 1995 cost = 0.01% of 1970s time
Advances in Computer 1945 Computer (US) 1947 Transister (Bell Labs) 1971 Microprocessor (Intel) 1982 PC (IBM) 1970s: 5,000 computers worldwide 1996: 140M (US: 35 comp / 100 people AU: 27 comp / 100 people) 28,000 times / 25 years
Advances in Communication 1876 Telephone (Alexander G. Bell) 1890 Telephone network 1920s Fax, movie transmission (BL) 1940s Mobile phone (1983 cellular, BL) 1958 Laser (BL) 1969 Internet 1980s Digital transmission, optical fiber 1990s WWW
Advances in Communication Telephone Network: 1960s Undersea cable carries 138 calls 1996 Fiber optic cable carries 1.5M calls 10,000 times / 35 yreas Data Network: 1969 4 hosts on Internet 1983 500 hosts 1995 4.5M hosts, 30M users 10,000 times / 12 years
Analogy: Car If car technology has been advancing as fast: • US$ 5 /car [US$ 25,000 /car] • 100 km / lt [8 km / lt]
2nd Circle: IT-using • Diffusion of IT technology in industry • US investment in computers rising at 20-30%/year • 1970: 7%, 1996: 40% • Before early 1980s, AT&T has little presence outside US By late 1990s, Bell Labs in Netherland, China, etc • Networking allows organizations to coordinate their decisions & activities globally. Fig. 5, Economist, survey 28/9/1996
Trade & Investment • Globalization 1986 - 96 Int’l trade grew twice as fast as output Foreign direct investment 3 times 1996 Foreign exchange trading US$1.3 tr/day Global cross-border transactions in bond & equity: 1970: 3% US GDP 1995: 136% US GDP
“Little Productivity Gain” • Productivity gain (output/worker, big-7 avg) • 1960 - 73 : 4.5% • 1973 - 95 : 1.5% • Two reasons: • measurement error • time to learn and change
Measurement Error • Service industry exceeds agricultural & mining industries • US workers in agriculture • 1820: 75% • 1996: 3% • Easy to measure agriculture & manufacturing outputs • Productivity gain has been quite significant • Difficult to measure service “output”
Learning & Diffusion Time • Time to learn to use technology • Time to reorganize economic & societal activities • Time for technology to mature & diffuse Example: Car 1877 Internal-combustion engine patented 1925 Different city planning conceptualized 1960s Large shopping malls along highway 50 yrs of learning & diffusion 40 yrs of reorganizing
Learning & Diffusion Time Example : Electricity 1880s Electro dynamo 1899 Electricity < 5% of power in US 1919 Electricity ~50% of power in US 40 yrs to mature and diffuse Before: machines around water wheels & steam engines After: assembly lines to optimize work flow
3rd Circle: Social Life • Social & Economic Life • Globalization of culture • More intrusive government • Breakdown of monopoly of propaganda • Cultural islands • 30M users on Internet in 1995 • USENET: 10M news articles/month • 3M Web pages in 18 months to 7/95 • March 97: of 220M people >16 in US & Canada 23% (50M) use Internet 17% (37M) on Web
Summary • IT : processing, storage & communication of information • Information Revolution • Core IT industries • IT-using industries • Social & economic life • Communication networks : key sector of IT
Outline • Information revolution • 3 circles of impact • Network growth • 4 driving forces
Networks Industry US Communications Industry (1994) Telephone US$ 200 B/yr Computer 80 Newspaper 60 Broadcasting 50 Books 15 US$ 400 B/yr Networks : 70% of communications industry
Communication Services Voice Telephone (wired & mobile), Pager, Radio Image Fax, WWW Data Fax, Email, WWW Multimedia TV, Tele-conferencing, Video-conferencing, VoD
Network Growth Factors promoting network growth Digitization Economy of scale Network externalities Service integration
S -> E E -> S t t Transmitted signal Received signal Analog Transmission Telephone
11 10 01 00 00 10 11 10 01 01 10 11 A/D D/A t t Digital Transmission • Digitization (Analog -> Digital) • Digital transmission • Reconstruction (Digital -> Analog) 10111001011011
Digitization Nyquist’s Samplilng Theorem Sampling rate > 2 x max frequency e.g. Sinusoidal signal of freq w ==> sampling rate = 2w samples/sec Voice max freq = 4 kHz ==> sampling rate = 8 samples/sec
Digitization Quantization Error SNR due to quantization ~ 6N dB (SNR = 100.6N, N = bits/sample) e.g. Telephone voice 48 dB Low quality cassette 55 High quality cassette 68 CD 96
Digital Data Voice Max freq = 4 kHz ==> sample @ 8000 sample/sec Req SNR = 48 dB ==> N = 48/6 = 8 bits/sample Uncompressed digital voice: 8k x 8 = 64 kbps CD Max freq = 20 kHz ==> sample @ 40,000 samples/sec Req SNR = 96 dB ==> N = 96/6 = 16 bits/sample Uncompressed stereo CD: 40k x 16 x 2 = 1.3 Mbps 70-min CD stores 1.3M x 70 x 60 / 8 = 682.5 MB NTSC TV Max freq = 4.5 MHz ==> sample @ 9 M sample/sec Req SNR = 48 dB ==> N = 48/6 = 8 bits/sample Uncompressed NTSC TV: 9M x 8 = 72 Mbps
t t 1 0 1 1 0 1 1 0 1 1 0 1 Advantages of Digitization • Low transmission error (esp long distance) • Compression, error correction, signal processing UncompressedCompressed Voice 64 kbps 16 kbps (GSM IS54), 8 kbps NTSC TV 72 Mbps 1.5 Mbps • Same fidelity over time • Ease of storage, manipulation, and distribution
“Large is Good” • Economy of scale • Cost increases more slowly than computing or communication capacity ==> multiplexing decreases per-user cost • Fixed costs, e.g. network administration, operation, and maintenance • Network externalities e.g. Telephone network, Internet (137 countries reachable by Email), inter-networking,
Benefit Unit cost Number of users Critical size Critical Size • Below critical size: cost > benefit • Above critical size: cost < benefit Positive feedback fuels growth • Subsidy needed before critical size is reached e.g. Internet, French Minitel Network, AT&T’s Picturephone
Economy of Scope • Service integration • Cheaper to have one integrated-services network than multiple single-service networks • Internet • telephone, data, broadcast TV & radio and CATV, news, magazines, books, digital library • tele-commuting, tele-banking, tele-education • Restructuring of industry • Alliances of communications & media giants e.g. US West - Time Warner, Bell Atlantic - Telecommunications, South West Bell - Cox
Outline • Information revolution • 3 circles of impact • Network growth • 4 driving forces • Network basics
Network Basics • Applications Traffic characterization, quality requirement • Network types Switched, broadcast • Network elements Switches, links • Network mechanisms Multiplexing, switching, switches, routing, flow control, error control, medium access control, protocol layering
Applications • Applications • Telephone, Email, WWW, Video-conferencing, ... • Traffic characterization • Constant bit rate (Telephone, Video-conferencing) • Variable bit rate (Video-conferencing) • Messages (Email, WWW) • Quality requirement • Small delay (Telephone, Video-conferencing) • Small loss (Email, WWW)
Examples Applications Traffic Quality Telephone CBR Small delay, moderate loss Email Message Large delay, no loss WWW Message Small delay, small loss Video (uncomp) CBR Small delay, moderate loss Video (comp) VBR Small delay, small loss
Communication Networks Switched Networks Broadcast Networks Wireless (radio, satellite, optical) Wired (LAN) Circuit Switching Packet Switching Virtual Circuit Datagram Network Types
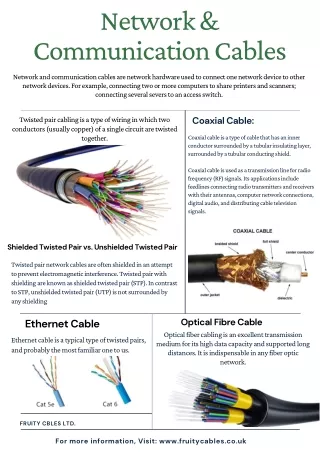
User Switch Link Network Elements • User : telephone, computer, fax, camera, display, ... • Link : transfers bit stream at a certain rate with a given bit error rate & propagation delay e.g., optical fiber, copper coaxial cable, radio • Switch : directs incoming bits to appropriate outgoing link
Network Mechanisms • Multiplexing & switching • Sharing a link by many users • Switches • Space division, time division • Routing • Selecting a path end-to-end • Flow control • Avoiding congestion • Error control • Recovery from error or loss • Medium access control • Sharing a broadcast medium
collision Total spectrum time ... ... n n 1 1 2 2 frequency time Multiplexing • Allows many bit streams to share same transmission link • Frequency division multiplexing (FDM) • Time division multiplexing (TDM) • Code division multiplexing (CDM) Radio, TV, cellular Telephone, internet, cellular Mobile network
Switching • Three modes • Circuit Swiching : digital & analog transmission • Virtual Circuit : digital transmission (packet switching) only • Datagram : digital transmission (packet switching) only • Increasing simplicity and flexibility • Decreasing service quality
Switching • Circuit Switching • 3 Phases: Connection setup, Data transmission, Connection clearing • Packets arrive in order • Dedicated resources, e.g., synchronous TDM slot • No queueing delay, only propagation delay
1 2 3 Switching • Virtual Circuit • 3 Phases: Connection setup, Data transmission, Connection clearing • Packets arrive in order • NO dedicated resources, e.g., statistical multiplexing • Queueing delay, in addition to propagation delay
1 3 2 Switching • Datagram • No connection setup • Packets may arrive out of order • No dedicated resources, e.g., statistical multiplexing • Queueing delay, in addition to propagation delay • Advantage : simplicity & robustness against network failure
TCP/IP Protocol Stack Applications (e.g. Telnet, HTTP) TCP UDP ICMP IP ARP Link Layer (e.g. Ethernet, ATM) Physical Layer (e.g. Ethernet, SONET)
Packet Terminology Application Message MSS TCP Segment TCP hdr TCP data 20 bytes IP Packet IP hdr IP data 20 bytes Ethernet Frame Ethernet Ethernet data 4 bytes MTU 1500 bytes 14 bytes
IP Header 0 1 2 3 0 1 2 3 4 5 6 7 8 9 0 1 2 3 4 5 6 7 8 9 0 1 2 3 4 5 6 7 8 9 0 1 Vers(4) Total Length (16 bits) H len Type of Service Identification Fragment Offset Flags Protocol (TCP=6) Time to Live Header Checksum Source IP Address Destination IP Address Options Padding IP data
TCP Header 0 1 2 3 0 1 2 3 4 5 6 7 8 9 0 1 2 3 4 5 6 7 8 9 0 1 2 3 4 5 6 7 8 9 0 1 Source Port Destination Port Sequence Number (32 bits) Acknowledgement Number (32 bits) Data Offset ACK URG FIN SYN RST PSH Receive Window (16 bits) Reserved Checksum Urgent Pointer Options Padding TCP data
RTT 1 2 W 1 2 W data ACKs 1 2 W 1 2 W Window Flow Control • ~ W packets per RTT • Lost packet detected by missing ACK Source time Destination time
Challenges • Distributed control and optimization … • Routing • Flow control • Medium access control • … over an uncertain unreliable network • Error control • Fault detection and recovery • Real time control using networks • Sensor networks
User Switch Link Outline of Course • Switch design (0.5 wk) • Error control: error detection, ARQ (1 wk) • Delay analysis: queueing models (1.5 wk) • Medium access control (1 wk) • Routing (1.5 wk) • Flow control (1.5 wk)
CS/145 b: Flow Control • Basic tools • Optimization theory • Linear control theory • Lyapunov stability • Internet congestion control • TCP • Queue management