Download
1 / 16
160 likes | 298 Views
Carbon Emissions from the University of Minnesota. Buildings & Facilities Andrew Edwins David Grandall Luke Hollenkamp Patrick Santelli Amy Scheller. President’s Climate Commitment. Initiate the development of a comprehensive plan to achieve climate neutrality as soon as possible

E N D
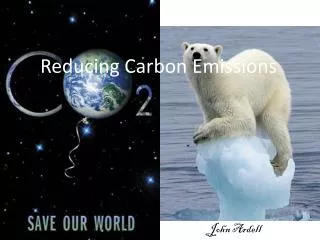
Carbon Emissions from the University of Minnesota Buildings & Facilities Andrew Edwins David Grandall Luke Hollenkamp Patrick Santelli Amy Scheller
President’s Climate Commitment • Initiate the development of a comprehensive plan to achieve climate neutrality as soon as possible • Complete a Greenhouse Gas inventory by January 2009 • Within one year of signing this document, complete a comprehensive inventory of all greenhouse gas emissions (including emissions from electricity, heating, commuting, and air travel) and update the inventory every other year thereafter. • Develop an Action Plan by January 2010 • Within two months of signing this document, create institutional structures to guide the development and implementation of the plan. • Within two years of signing this document, develop an institutional action plan for becoming climate neutral • Initiate two or more items from a list of tangible actions to reduce greenhouse gases while the more comprehensive plan is being developed
TC Campus Energy Diagram STEAM FUEL ELECTRICITY Southeast Steam Plant Campus Buildings Xcel Power Plants FUEL ELECTRICITY
Fuel Inputs – Xcel Energy • 9% Renewable Energy in 2007 • Increased Renewable Mandates 15% 2010 18% 2012 25% 2016 30% 2020
Fuel Inputs – Southeast Steam Plant • Varying Fuel Inputs • Coal • Natural Gas • Oats Hulls w/ Coal
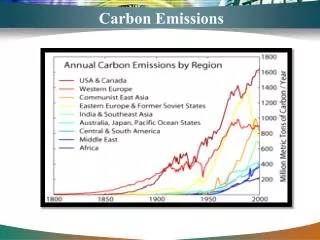
Past CO2 Emissions Trend 14.5% Reduction
Predicted CO2 Emissions Trend 12.1% Reduction
CO2 Reduction Policies • Demand Side • New Buildings • LEED Design • ENERGY STAR Design • Existing Buildings • Retrocommissioning • Behavioral Changes • Supply Side • Renewable Energy • Wind
Demand Side – New Buildings (LEED) • Leadership in Energy and Environmental Design (LEED) by USGBC • Achieve LEED-NC Silver rating • Focus on Energy Reduction points • Beginning in 2009, U of M has 1% additional square footage per year as Silver • 12% Silver buildings by 2020 lowers CO2 emissions by 3.84% • Costs $8,692,458 for each 1% CO2 reduction in 2009 (*could have no cost)
Demand Side – New Buildings (ENERGY STAR) • ENERGY STAR building program by US EPA & US DOE • ENERGY STAR buildings perform better than 75% of peers • On average, consume 40% less energy and emit 35% less CO2 • Beginning in 2009, U of M has 1% additional square footage per year as ENERGY STAR • 12% ENERGY STAR buildings by 2020 lowers CO2 emissions by 4.20% • Negligible cost for each 1% CO2 reduction in 2009
Demand Side – Existing Buildings (Retrocommissioning) • Reevaluating existing building systems for functionality and efficiency. • Annually assess 20% of buildings; retrocommission 10% • All campus buildings are evaluated every five years. • By 2020, lowered CO2 emissions by 4.50% • $1,000,000 annual expenditure is replenished by decreased utility costs
Demand Side - Behavioral • Oberlin College • Real time metering • 32% Reduction • 2 – 3 year payback • General Recommendations • Alliance to Save Energy’s Green Campus Program • Energy Star for Higher Education • Association for the Advancement of Sustainability in Higher Education
Supply Side – Renewable Energy (Wind) • Purchase additional wind power through Xcel’sWindsource program • $0.71/100kWh during first half of 2008 • Beginning in 2009, U of M purchases 1% additional consumption per year • 12% Windsource by 2020 lowers CO2 emissions by 7.74% • Costs $46,814 for each 1% CO2 reduction in 2009 • Xcel’s capacity is an issue
Policy Effects ENERGY STAR -4.20% Windsource -7.74% LEED Silver -3.84% Retrocomm -4.50%