Download
1 / 29
290 likes | 518 Views
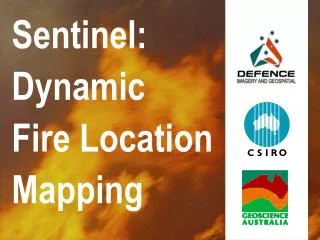
Sentinel: Dynamic Fire Location Mapping. Near- Real Time Emergency Mapping. ‘Sentinel’ Satellite Mapping of Fire Hotspots. Environmental Remote Sensing Group CSIRO Land and Water Defence Imagery & Geospatial Organisation. Collaborators.

E N D
Sentinel: Dynamic Fire Location Mapping
Near- Real Time Emergency Mapping ‘Sentinel’ Satellite Mapping of Fire Hotspots Environmental Remote Sensing Group CSIRO Land and Water Defence Imagery & Geospatial Organisation
Collaborators • FundingDefence Imagery and Geospatial Organisation (DIGO) • ImageryGeoscience Australia (GA) • ImplementationCSIRO • Using NASA and University of Maryland algorithms • Based on GeoMAC fire site hosted by the USGS.
DIGO’s needs • Support Defence personneldeployed in civil emergencies • Continental solution • Identified MODIS data as a possible solution
Key Requirements • All Australia Hotspot Mapping by December 2002 • Satellite to Website in One hour. • MODIS sensor selected • for it’s dynamic range • it’s revisit frequency • Terra and Aqua platforms
Key Requirements • Background imagery • for context • underneath the ‘hotspots’ • by 6 am AEST (18:00 UTC). • Maps with fire locations delivered as • electronic graphic images (web map interface) • faxable B/W map products • email data distribution.
“SENTINEL” ProjectDaily Hotspot Detection Example Dec. 26 – Jan. 10 Sequential days in different colours January 1 – 24 ‘02
Terra Satellite Launched December 18,1999 MODIS MOPITT ASTER MISR CERES
MODerate-resolution Imaging Spectroradiometer (MODIS) • NASA, Terra & Aqua • launches 1999, 2002 • 705 km polar orbits, descending (10:30 a.m.) & ascending (1:30 p.m.) • Sensor Characteristics • 36 spectral bands ranging from 0.41 to 14.385 µm • cross-track scan mirror with 2330 km swath width • Spatial resolutions: 250 m (bands 1 - 2) 500 m (bands 3 - 7) 1000 m (bands 8 – 36) • 2% reflectance calibration accuracy • onboard solar diffuser & solar diffuser stability monitor http://modis.gsfc.nasa.gov/
MODIS Synoptic CoverageJune 24, 2002 Terra image Aqua image three hours later (images courtesy of the NASA MODIS Science Team)
Other Natural Events that requiresub-daily Monitoring & Tracking Dust Cloud October 23, 2002 10:05 am (Terra) 1:35 pm (Aqua)
Other Natural Events that Require Daily Monitoring & Tracking Typhoon Silaku off Japan Sept. 4/2002 Phytoplankton Blooms Gulf of St. Vincent, Feb. 19, 2002
Implementation Peter Dyce & Alan Marks CSIRO Land and Water
Hotspot Locations are generated by combining information from several MODIS bands. HOTSPOT DETECTION
ACRES Data Acquisition Facility Alice Springs HOTSPOT Linux server Data Transferredas a text file to Canberravia secure copy protocol Image Processing: • Conversion of signal to imagery • Geolocation. • Calibration. • Fire Product Processing • Fire Location point extraction Image Reception Image receivedby X-Band Receiver INFRASTRUCTURE…
SDE-bu GIS database IMS-bu Map Server Web Server Map Making • Map Server receives requests from Web Server • Queries made • GIS Layers and Imagery combined to generate maps which are sent to the Web Server Incorporation into GIS • Data reformatted • Imported into Geodatabase • Database processes queries from the Map Server and datareturned. Web Map Serving • Web Server receives requests from clients (user browsers) • Requests Passed to the Map server • Maps served to the clients INFRASTRUCTURE… Canberra
PRODUCTS… Hotspotdatafile -19.525,147.465,322.6,1.0,1.0 -19.527,147.475,331.0,1.0,1.0 -19.703,145.773,333.0,1.1,1.0 -20.023,145.398,332.1,1.1,1.0 -20.566,148.250,330.5,1.0,1.0 -20.293,146.196,330.7,1.0,1.0 -20.294,146.206,342.2,1.0,1.0 -20.296,146.216,342.7,1.0,1.0 -20.250,145.858,329.5,1.1,1.0 -20.305,146.214,330.0,1.0,1.0 -20.261,145.867,330.3,1.1,1.0 -20.314,146.213,331.3,1.0,1.0 -20.315,146.223,337.1,1.0,1.0 -20.325,146.221,332.5,1.0,1.0 -20.595,145.525,330.7,1.1,1.0 -20.669,145.464,332.4,1.1,1.0 -20.935,145.180,365.2,1.1,1.0 + = Hotspot data map layer Geographic Data provides context.
Internet Dissemination Canberra Internet
The SENTINEL Bushfire Website www.sentinel.csiro.au
Web Maps are Dynamic. • Fire Locations are displayed in relation to other Geographic data • Maps are rendered and displayed on according to user interaction • Contextual layers can be added or removed. • Maps can be panned and zoomed. • Maps Layers are scale sensitive providing more information atlarge scaleswithout clutteringthe display at small scales.
Future Earth Observing System Concept SENTINEL AUSTRALIA Delivery System: FireMap LandCam CoastCam RiverCam Top Level Projects: • ‘Wealth from Oceans’ • Coastal Managers • HC-FP • Fisheries/Aquaculture • Rainforest-Reef Joint Bid • DIGO • EMA • RFS • E-Australia FP • HC-FP • NRM Landcare • Rainforest CRC • MDBC • NRM Boards Linkages: : Specialised Projects: SugarCam ReefCam • QSL • Canegrowers, Mills • GBMPA/AIMS