Download

1 / 14
140 likes | 314 Views
BCC.01.2 - A Closer Look at Rates of Change: The Tangent Problem. MCB4U - Santowski. (A) Review. Average Rate of Change = which represents a secant line to a curve

E N D
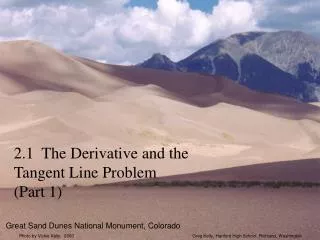
BCC.01.2 - A Closer Look at Rates of Change: The Tangent Problem MCB4U - Santowski
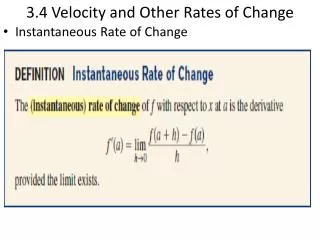
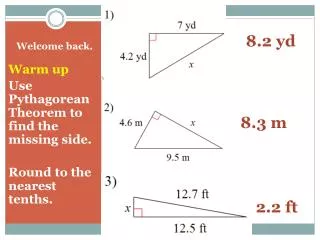
(A) Review • Average Rate of Change = • which represents a secant line to a curve • Instantaneous Rate of Change at x1 can be estimated by making the interval x2 - x1 smaller and smaller which we can present as a tangent line to the curve at the point x1
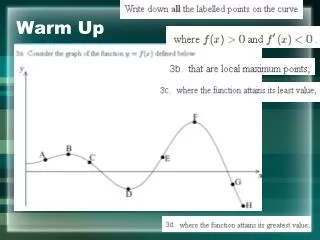
(B) Tangent Slopes • We can estimate tangent slopes at a given point x = a (the tangency point) from secant slopes by drawing and determining the slopes of secants lines from point x1, x2, ......, xn as seen on the previous diagram • When we move our secant point x1, x2, ......, xn closer and closer to our tangency point at x = a, we create a sequence of secant slopes which we can use as estimates of our tangent slope is there an end or a limit to the secant slopes??? The answer is yes. • As our secant point x1, x2, ......, xn gets closer and closer to our tangency point, a second note is that the interval between xn and x = a (which we can call x) gets smaller and smaller and approaches 0. • We can write that as x 0 or we can also present as it xa
(C) Internet Links - Applets • The process outlined in the previous slide is animated for us in the following internet links: • Secants and tangent • A Secant to Tangent Applet from David Eck • JCM Applet: SecantTangent • Visual Calculus - Tangent Lines from Visual Calculus – Follow the link for the Discussion
(D) Tangent Slope Equations • We can put the last two ideas together in a special notation
(E) Limits of Tangent Slopes • To interpret these statements, we are looking at a sequence of secant slopes (y/x) that happen to reach some limiting slope value. The limiting slope value we reach is the tangent slope. • To see this idea from a table of values generated from the limit equation given in the previous slide, follow the link below: • Visual Calculus - Slopes of Tangent Lines
(F) Example #1 • ex 1. Let f(x) = ½ x² and we will find the slope of the tangent at the point (1,1). We will set it up by working through the following table: • we can make use of the previous link from Visual Calculus • Or we can use the secant formula as follows:
(G) Example #2 • Find an equation to the tangent line to f(x) = 3x3 + 2x - 4 at the point (-1,-9). • An alternative approach to this solution is that we can generate an equation to help us out slope of EVERY secant = • So the rational equation msecant = (3x3 + 2x + 5)/(x+1) will generate for us every slope of every secant that we are wanting to calculate we simply input the secant point’s x co-ordinate and thereby generate the secant slope between our 2 points • To simplify the process, given our previous observations from Example #1, let’s substitute in x = -1.0001 into our equation to estimate the tangent slope then tangent slope = 11.0009 so our tangent slope estimate would be 11 • Thus y = 11x + 2 would be our tangent slope
(H) Example #3 • ex 3. Dwayne drains a tub which holds 1600 L of water. It takes 2 h for the tub to drain completely. The volume of water remaining in the tub is V(t) = 1/9(120 – t)² where V is volume in litres and t is time in minutes. • (a) Determine the average rate of change during the second hour • (b) Determine the instantaneous rate of change after exactly 60 minutes
(I) Internet Links • Calculus I (Math 2413) - Limits - Tangent Lines and Rates of Change from Paul Dawkins at Lamar University • Calculus@UTK 2.2 - Limits of Functions - Applets, Explanations, Flash Tutorials
(J) Homework • Nelson text, page178, Q3a,6,8 • Nelson text, page 190, Q2,3,4,5,8,9,11