Download
1 / 1
10 likes | 106 Views
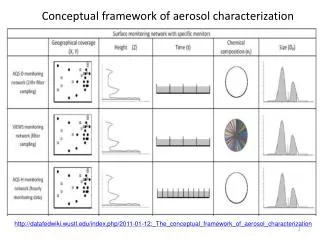
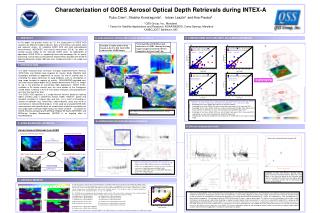
This study analyzes LIDAR aerosol backscatter profiles at UMBC between 4 and 5 km, indicating long-range transport in the free troposphere. It examines smoke plumes from Canada to the US in July 2004 using GOES Imager data and compares GOES Aerosol Optical Depth retrievals during INTEX-A with aircraft measurements. The assessment includes the effects of aerosol model variations on GOES AOD, applicability in air quality monitoring, and potential improvements with GOES-R ABI. The paper highlights uncertainties in AOD retrievals and ongoing efforts to validate GOES data against AERONET and MODIS.

E N D
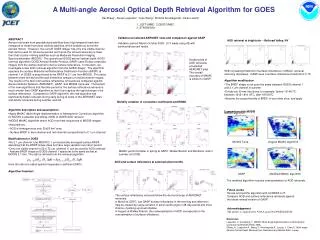
Vertical profiles of LIDAR aerosol backscatter at UMBC showing that long range transport occurred in the free troposphere between 4 and 5 km Transport of smoke p lumes from Canada to the US, July 16-20, 2004 as observed by GOES Imager Characterization of GOES Aerosol Optical Depth Retrievals during INTEX-A Pubu Ciren1, Shobha Kondragunta2, Istvan Laszlo2 and Ana Prados3 1QSS Group, Inc., Maryland 2 Center for Satellite Applications and Research, NOAA/NESDIS, Camp Springs, Maryland 3UMBC/JCET, Baltimore, MD 1. ABSTRACT 3. GOES AEROSOL OPTICAL DEPTH (AOD) DURING INTEX-A 5. COMPARIOSNS WITH AIRCRAFT (DC-8) MEASUREMENTS In this paper, we present results on: (1) the assessment of GOES AOD variations on different temporal (diurnal, daily, and monthly) and spatial (local and regional) scales, (2) validating GOES AOD with both ground-based measurements (AERONET) and aircraft measurment (DC-8), (3) effect of varying aerosol model on the retrieved GOES AOD., (4) applicability of operational GOES AODs in supporting future field campaigns for air quality monitoring, and (5) discuss the potential improvements possible with GOES-R Advanced Baseline Imager (ABI) due to its multiple channels in the visible and infrared. a. b. e. 1. INTRODUCTION The 2004 Intercontinental Chemical Transport Experiment-North America (INTEX-NA) and NOAA’s New England Air Quality Study (NEAQS) field campaigns provided an opportunity to assess the role of satellite data in extending the spatial dimension to study problems such as contribution of long range transport to regional air quality. NOAA/NESDIS provided near real time aerosol optical depth (AOD) product derived from GOES-12 Imager to aid in the planning of aircraft/ship flight deployment. GOES AODs, available at 30 minute interval over the sunlit portion of the Contiguous United States (CONUS) in 4 km X 4 km spatial resolution, were provided with one hour time lag to the field. The GOES AOD algorithm is a single-channel retrieval based on look-up tables created using a continental aerosol model. However, spatial and temporal variations in aerosol type and size as a result of changing in sources of pollution (e.g., forest fires, urban/industrial, dust) may result in uncertainies in retrieved AOD product. In this study we analyzed GOES AOD measurements with specific focus on uncertainties related to assumptions of one single type of aerosol model across the whole CONUS. Evaluation of GOES AODs by comparing with AERosol RObotic NETwork (AERONET) and MODerate Imaging Spectrometer (MODIS) is an ongoing effort at NOAA/NESDIS. c. d. aloft aerosol layer • Comparison of with aircraft (DC-8) measured AOD with collocated GOES AOD over INTEX-A domain. There are 71 flight tracks during the time period from July 1 and July 24, 2004 • Scatterplot of the mean GOES AOD against DC-8 measured AOD • Scatterplot of the mean GOES AOD over aircraft flight track against DC-8 measured AOD • Scatterplot of the mean GOES AOD over a box containing aircraft flight track against DC-8 measured AOD, respectively for cases with and without elevated AOD above 3km. • Scatterplot of the mean GOES AOD over aircraft flight track against DC-8 measured AOD , respectively for cases with and without elevated AOD above 3km. • Vertical profile of Extinction coefficient measured by DC-8. GOES AOD is also shown as a base image Mean GOES aerosol optical depth during the time period of July and August, 2004 4. COMPARISONS WITH AERONET MEASURESMENTS 2. GOES-M AEROSOL RETRIEVAL 6. Effect of varying aerosol model Current Aerosol Retrieval from GOES Background composite image (21 days) Retrieved surface reflectivity Mean ratio: smoke/continental aerosol~0.86 LUT (background AOD 0.04) INTEX-A study domain and corresponding AERONET sites GOES-12 (East) Visible Image (channel 1) LUT Retrieved GOES AOD(4x4 km), 1/2 hour • Comparison of GOES AOD with AERONET AOD over INTEX-A domain and during the time period from July 1 to August 30, 2004 • Relative error of GOES AOD as a function of scattering angle • Relative error of GOES AODas a function of surface reflectance • Scatter plot of GOES AOD against AERONET AOD • Daily mean of GOES AOD (red line) and AERONETAOD (black) as a function of day of the year • Relative error of GOES AOD as a function of solar zenith angle cloud mask CLAVR method (GOES-12 IR channels 2 and 4) Scatterplot of AOD from biomass burning aerosol against AOD from continental aerosol. Note that results shown in this figure are based on the retrieved AOD from the simulated TOA reflectance with original GASP LUT (i.e., continental aerosol) and LUT generated with biomass burning aerosol 5. AEROSOL MODELS In order to be able to retrieve aerosol optical properties, information about aerosol model on both temporal and spatial scale is required. MISR aerosol climatology product is based on classification of the aggregated results from global transport model. It has 13 types of aerosol mixing groups (left figures), based on relative abundance of 4 out of 6 basic components (i.e., sulfate, seasalt, carbonaceous, accumulated dust, coarse dust and black carbon) . The left figures shows the spatial distribution of aerosol models for (a). January; (b). April; (c). July; (d). September. The 13 MISR aerosol mixing groups (5 major groups, each consists of the same 4 basic components, they are further divided into subgroups according to the percentage of number density of each component) are given as follow: 1a. Carbonaceous+ Dusty Maritime 4a. Carbonaceous+ Dusty Continental 1b. Carbonaceous+ Dusty Maritime 4b. Carbonaceous+ Dusty Continental 1c. Carbonaceous+ Dusty Maritime 4c. Carbonaceous+ Dusty Continental 2a. Dusty maritime+ Coarse Dust 5a. Carbonaceous+ Black Carbon Continental 2b. Dusty maritime+ Coarse Dust 5b. Carbonaceous+ Black Carbon Continental 5c. Carbonaceous+ Black Carbon Continental 3a. Carbonaceous+ Black Carbon Maritime 3b. Carbonaceous+ Black Carbon Maritime 1a 1b 1c 2a 2b 3a 3b 4a 4b 4c 5a 5b 5c a c From the simulated GOES-12 Ch1 TOA reflectance (see left figure), it is shown that evident difference in TOA reflectance exists between aerosol model 4 and aerosol model 5 for continental aerosol type, however, very small difference is seen among subgroups for each aerosol model. Same feature are shown for maritime aerosol as well. In general, the major difference among aerosol groups is the varying concentration of nonabsoring (i.e., sulfate), less absorbing (i.e., dust) and absorbing (i.e., black carbon) components. The consequent effect on GOES AOD retrieval is clearly shown in above figure. This figure is the same to the figure in the left box, except that biomass burning aerosol model (more absorbing) is applied instead of typical continental aerosol. It is seen that a reduced AOD (about 20%) is produced after applying biomass burning aerosol. Although GOES-12 does not have the ability to distinguish the aerosol, however, by applying prescribed aerosol model climatology, such as the oen from MISR, will improve the accuracy of AOD retrieval on a climatologic sense. ABI on board GOES-R – future GOES, will provide calibrated observations over multi-channels with higher refresh rate and spatial resolution, compared to current GOES. These features expand the frequency and coverage of aerosol remote sensing that can support a wide range of weather and environmental applications including the monitoring of air quality. b d The figure on the right shows the simulated GOES-12 ch1 TOA reflectance as a function viewing zenith anglefor 13 MISR aerosol types.