Download
1 / 41

E N D
Chapter 1 An Introduction to Econometrics Walter R. Paczkowski Rutgers University
Chapter Contents • 1.1 Why Study Econometrics • 1.2 What is Econometrics About • 1.3 The Econometric Model • 1.4 How Are Data Generated • 1.5 Economic Data Types • 1.6 The Research Process • 1.7 Writing An Empirical Research Paper • 1.8 Sources of Economic Data
1.1 Why Study Econometrics
1.1 Why Study Econometrics • Econometrics fills a gap between being a “student of economics” and being a “practicing economist” • It lets you tell your employer: • “I can predict the sales of your product” • “I can estimate the effect on your sales if your competition lowers its price by $1 per unit” • “I can test whether your new ad campaign is actually increasing your sales” • Helps you develop “intuition” about how things work and is invaluable if you go to graduate school
1.2 What is Econometrics About
1.2 What is Econometrics About Econometrics is about how we can use theory and data from economics, business, and the social sciences, along with tools from statistics, to answer ‘‘how much’’ questions.
1.2 What is Econometrics About • In economics we express our ideas about relationships between economic variables using the mathematical concept of a function
1.2 What is Econometrics About • Every day, decision-makers face ‘‘how much’’: • A city council ponders the question of how much violent crime will be reduced if an additional million dollars is spent putting uniformed police on the street • The owner of a local Pizza Hut must decide how much advertising space to purchase in the local newspaper, and thus must estimate the relationship between advertising and sales • Louisiana State University must estimate how much enrollment will fall if tuition is raised by $300 per semester, and thus whether its revenue from tuition will rise or fall • The CEO of Proctor & Gamble must estimate how much demand there will be in ten years for the detergent Tide, and how much to invest in new plant and equipment 1.2.1 Some Examples
1.2 What is Econometrics About • Every day, decision-makers face ‘‘how much’’ questions (Continued): • A real estate developer must predict by how much population and income will increase to the south of Baton Rouge, Louisiana, over the next few years, and whether it will be profitable to begin construction of a gambling casino and golf course • You must decide how much of your savings will go into a stock fund, and how much into the money market. This requires you to make predictions of the level of economic activity, the rate of inflation, and interest rates over your planning horizon • A public transportation council in Melbourne, Australia, must decide how an increase in fares for public transportation (trams, trains, and buses) will affect the number of travelers who switch to car or bike, and the effect of this switch on revenue going to public transportation 1.2.1 Some Examples
1.3 The Econometric Model
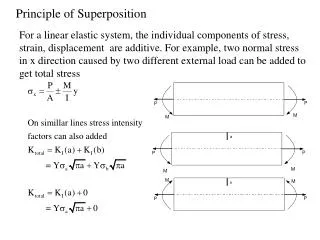
1.3 The Econometric Model • An econometric model consists of a systematic part and a random and unpredictable component e that we will call a random error
1.3 The Econometric Model • The coefficients β1, β2, …, β5 are unknown parameters of the model that we estimate using economic data and an econometric technique • The functional form represents a hypothesis about the relationship between the variables • In any particular problem, one challenge is to determine a functional form that is compatible with economic theory and the data
1.3 The Econometric Model • The systematic portion is the part we obtain from economic theory, and includes an assumption about the functional form • The random component represents a ‘‘noise’’ component, which obscures our understanding of the relationship among variables, and which we represent using the random variable e
1.3 The Econometric Model • We use the econometric model as a basis for statistical inference • The ways in which statistical inference are carried out include: • Estimating economic parameters, such as elasticities, using econometric methods • Predicting economic outcomes, such as the enrollment in two-year colleges in the United States for the next ten years • Testing economic hypotheses, such as the question of whether newspaper advertising is better than store displays for increasing sales
1.4 How are Data Generated?
1.4 How Are Data Generated? • We must have data • Where do data come from? • What type of real processes generate data? • Economists and other social scientists work in a complex world in which data on variables are ‘‘observed’’ and rarely obtained from a controlled experiment • This makes the task of learning about economic parameters all the more difficult
1.4 How Are Data Generated? • One way to acquire information about the unknown parameters of economic relationships is to conduct or observe the outcome of an experiment • Such controlled experiments are rare in business and the social sciences • There are some examples of planned experiments in the social sciences • A notable example of a planned experiment is Tennessee’s Project Star 1.4.1 Experimental Data
1.4 How Are Data Generated? • An example of nonexperimental data is survey data • Data on all variables are collected simultaneously, and the values are neither fixed nor repeatable • These are nonexperimental data 1.4.2 Non-experimental Data
1.5 Economic Data Types
1.5 Economic Data Types • Economic data comes in a variety of ‘‘flavors.” • Data may be collected at various levels of aggregation: Micro or Macro • Data may also represent a flow or a stock: • Flow: measured over a period of time • Stock: measured at a particular point in time • Data may be quantitative or qualitative: • Quantitative: expressed as numbers • Qualitative: expressed as an ‘‘either-or’’ situation
1.5 Economic Data Types • A time-series is data collected over discrete intervals of time • The key feature of time-series data is that the same economic quantity is recorded at a regular time interval 1.5.1 Time-Series Data
1.5 Economic Data Types Table 1.1 Annual GDP of Real 2005 Dollars 1.5.1 Time-Series Data
1.5 Economic Data Types Figure 1.1 Real U.S. GDP, 1980–2008 1.5.1 Time-Series Data
1.5 Economic Data Types • A cross-section of data is collected across sample units in a particular time period • The ‘‘sample units’’ are individual entities and may be firms, persons, households, states, or countries 1.5.2 Cross-Section Data
1.5 Economic Data Types Table 1.2 Cross Section Data: CPS August 2009 1.5.2 Cross-Section Data
1.5 Economic Data Types 1.5.3 Panel or Longitudinal Data • A ‘‘panel’’ of data, also known as ‘‘longitudinal’’ data, has observations on individual micro-units who are followed over time • The key aspect of panel data is that we observe each micro-unit for a number of time periods • If we have the same number of time period observations for each micro-unit, we have a balanced panel • Usually the number of time series observations is small relative to the number of micro-units, but not always
1.5 Economic Data Types Table 1.3 Panel Data from Two Rice Farms 1.5.3 Panel or Longitudinal Data
1.6 The Research Process
1.6 The Research Process • Econometrics is ultimately a research tool • Students of econometrics plan to do research or they plan to read and evaluate the research of others, or both • Research is a process, and like many such activities, it flows according to an orderly pattern • Research is an adventure, and can be fun!
1.6 The Research Process • Steps in the research process: • Use economic theory to think about the problem • Develop a working economic model leading to an econometric model • Obtain sample data and choose a desirable method of statistical analysis based on initial assumptions and an understanding of how the data were collected • Estimate the unknown parameters with the help of a statistical software package, make predictions, and test hypotheses
1.6 The Research Process • Steps in the research process (Continued) • Perform model diagnostics to check the validity of assumptions • Analyze and evaluate the economic consequences and the implications of the empirical results
1.7 Writing an Empirical Research Paper
1.7 Writing an Empirical Research Paper • The process of writing forces the distillation of ideas • In no other way will your depth of understanding be so clearly revealed
1.7 Writing an Empirical Research Paper 1.7.1 Writing a Research Proposal • An abstract should include: • A concise statement of the problem • Comments on the information that is available, with one or two key references • A description of the research design that includes • the economic model • the econometric estimation and inference methods • data sources • estimation, hypothesis testing and prediction procedures, including econometric software version • The potential contribution of the research
1.7 Writing an Empirical Research Paper • The following outline for a report is typical: • Statement of the problem • Review of the literature • The economic model • The econometric model • The data • The estimation and inference procedures • The empirical results and conclusions • Possible extensions and limitations of the study • Acknowledgments • References 1.7.2 A Format for Writing a Research Report
1.7 Writing an Empirical Research Paper • A style guide is a good investment. Two classics are: • The Chicago Manual of Style, 15th edition • Available online and in other formats • A Manual for Writers of Research Papers, Theses, and Dissertations: Chicago Style for Students and Researchers, 7th edition, by Kate L. Turabian; revised by Wayne C. Booth, Gregory G. Colomb, and Joseph M Williams (2007, University of Chicago Press) 1.7.2 A Format for Writing a Research Report
1.8 Sources of Economic Data
1.8 Sources of Economic Data • Economic data are much easier to obtain since the development of the World Wide Web
1.8 Sources of Economic Data • Resources for Economists (RFE) • National Bureau of Economic Research (NBER) • EconEdLink • Economagic 1.8.1 Links to Economic Data on the Internet
1.8 Sources of Economic Data • In many cases it is easier to obtain economic data than it is to understand the meaning of the data • Useful reference: • A Guide to Everyday Economic Statistics, 6th edition, by Gary E. Clayton and Martin Gerhard Giesbrecht, (Boston: Irwin/McGraw-Hill 2003) 1.8.2 Interpreting Economic Data
1.8 Sources of Economic Data • Finding a data source is not the same as obtaining the data. Although there are a great many easy-to-use websites, ‘‘easy-to-use’’ is a relative term • Some good sources: • The Federal Reserve Bank of St. Louis: FRED (Federal Reserve Economic Data). • The Current Population Survey (www.census.gov/cps/): Data Ferrett • The Penn World Tables 1.8.3 Obtaining the Data