Thinking Critically and Research Methods
Thinking Critically and Research Methods. AP Psychology Myers, Ch. 1. Limits of Intuition and Common Sense. “The naked intellect is an extraordinarily inaccurate instrument.” - Madeleine L’Engle (1977). Why Science?. How can we best understand why people think, feel, and act as they do?

Thinking Critically and Research Methods
E N D
Presentation Transcript
Thinking Critically and Research Methods AP Psychology Myers, Ch. 1
Limits of Intuition and Common Sense “The naked intellect is an extraordinarily inaccurate instrument.” - Madeleine L’Engle (1977)
Why Science? • How can we best understand why people think, feel, and act as they do? • Hunches? • Common sense? • Intuition? • Psychology needs a scientific approach to separate “common sense” and “hunches” from actual credible evidence. • Differ from person to person • Not always 100% correct • Always seem correct after the fact
Common Sense • Describes more easily what has already happened than it can predict what will happen in the future. • Things that seem like common sense or that we have taken as fact are in many cases proved wrong by psychological research. • “Dreams can predict the future.” • “Emotions are linked with a female’s menstrual cycle.” • “You catch a cold from being in a cold, wet environment.”
Hindsight Bias • The tendency to believe, after learning an outcome, that one would have foreseen it. • “I knew it all along phenomenon” • Hindsight is 20/20 – after the fact, it is easy to see why an event occurred, someone acted in a certain way, etc • Psychological findings often seem already known or like common sense because we constantly observe psychological phenomena or “knew it all along.”
Overconfidence • The tendency to overestimate our abilities, including knowledge (the illusion of knowledge) • Faster • Smarter • Stronger • More aware • More observant • Even after being presented with evidence that contradicts previous assumptions about ourselves, most claim, “Well I was close.”
Draw a bike. A B C D
I bet you were pretty confident you knew how to draw a bike… Our brains allow us to be overconfident to shield us from everything we DON’T know – “the illusion of knowledge” effect. How many of you are claiming, “I knew it all along!” (hindsight bias!) A
The Bottom Line Hindsight bias and overconfidence often lead us to overestimate our intuition. But scientific inquiry, fed by curious skepticism and by humility, can help us sift reality from illusions.
A Scientific Attitude “Experiment adds to knowledge. Credulity leads to error.” -Anonymous
Scientific Attitude • Being skeptical but not cynical, open but not gullible • Humility – being humble, often scientists must reject their own ideas/hypotheses • “The rat is always right.” • No matter how crazy an idea or hypothesis sounds… the questions are: Does it work? When put to the test, can its predictions be confirmed? • Things that we take as granted now, were once considered crazy but were proven true with scientific inquiry. • The brain is the primary “thinking” organ and is located in the head. • Mental illnesses are not the products of demonic possessions or evil spirits.
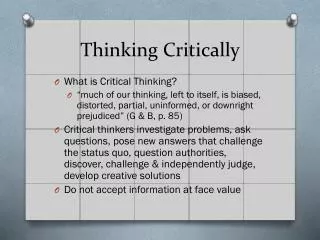
Critical Thinking • Smart thinking; does not blindly accept arguments and conclusions • How do you know this? • Is there an agenda here? • Is the conclusion based on evidence, not a hunch? • Are there any alternative conclusions?
Basis of Research • Theory – an explanation using an integrated set of principles that organizes and predicts observations • Must be put to the test before accepted as fact • Hypothesis – a testable prediction, often implied by a theory • Replication – repeating the essence of a research study, usually with different participants in different situations, to see whether the basic finding extends to other participants in other circumstances
The Scientific Method • A method in which scientists make observations, form theories, and then refine theories in the light of observations. Generate or refine… Lead to… Lead to…
Descriptive Methods Description is the starting point of any science. These types of research methods describe behaviors/attitudes, not explain them.
Case Study • An observation technique in which one person is studied in depth with the hope of revealing universal principles. • Pros: • Insight into specific cases that possibly could not be studied due to ethics • Can suggest further hypotheses for the future • Cons: • Individual studies are hard to generalize to large populations • Some events/circumstances cannot be replicated (ethics) • People interviewed could distort their experiences • Ex: brain lesion studies, instances of feral children
Survey • A technique for ascertaining the self-reported attitudes or behaviors of people, usually by questioning a representative, random sample of them. • Must have a representative and random sampling from the population for generalization to be possible • Population – all of the cases in a group from which samples may be drawn for study • Representative – reflective of the population • Randomsample – a sample in which all individuals have an equal chance of inclusion in the study • Generalization – the ability to reflect results from the random sample on the entire population
Survey • Pros: • Can study large populations from a representative sample • Cons: • Self-reporting is not always reliable • Social-desirability effect – the tendency of respondents to answer questions in a manner that will be viewed favorably by others. • Samples are not always representative • Results are largely based on how questions are worded (“aid to the needy” instead of “welfare”) • Ex: Gallup polls, Kinsey Report on sexuality
Naturalistic Observation • Observing and recording behavior in naturally occurring situations without trying to manipulate and control the situation. • The observer must not manipulate or stage the situation. • Pros: • Observe people/animals in real, not artificial, environments • Cons: • No control over events or variables • Ex: videotaping mothers and children together in different cultures, recording students’ self-seating patterns in the lunchroom
Correlational Methods Describing behavior is the first step to predicting it. When observed variables seem to relate to each other, it is said they correlate.
Correlational Research • A measure of the extent to which two factors vary together, and thus of how well either factor predicts the other. • How are two things related? • How strong is this relationship? • Can the relationship shape predictions? • Scatterplots – a graphed cluster of dots, each of which represents the values of two variables. The amount of scatter suggests the strength of the correlation (little scatter = more correlation)
Positive Correlation • Two variables rise or fall together • The taller you are, the more you weigh • The more you smoke, your risk of cancer increases • As temperature rises, crime rate increases • As the ocean level decreases, the fish population decreases
Negative Correlation • Two variables relate inversely to each other – as one rises, the other falls. • The more you brush your teeth, your risk of cavities decreases • The more years spent in jail, the lower the education level • The more you hold a baby, the less it cries • The more hours spent watching TV, the less time spent doing HW
No Correlation • Two variables do not seem to be related • People born later in the year and intelligence level
Correlation coefficient • The mathematical expression of the relationship, ranging from -1 to +1 • Measures how well either one predicts the other and how strong that relationship/prediction is (0 = no relationship) • r = +0.37 • r correlation coefficient (relationship) • + indicates direction of relationship (positive or negative) • 0.37 Indicates strength of relationship (0.00 weak to 1.00 strong) r = +1.00 r = 0 r = -1.00
Practice Positive or Negative Correlation? Strong , Moderate, or Weak Correlation? • Those with higher rates of depression tend to have higher risks of suicide. • The louder the music while studying, the lower the exam performance. • The more you observe aggression, the more aggression you display. • +0.71 • Fairly strong relationship • -0.13 • Fairly weak relationship • +0.46 • Moderate relationship
Correlation IS NOT Causation • Correlations cannot fully predict future behaviors/attitudes, regardless of how strong the correlation coefficient is. • Ex: low self esteem is correlated with depression, however this does not mean that low self-esteem directly causes depression. Could cause (1) Low self esteem Depression OR Could cause (2) Depression Low self esteem OR Depression (3) Distressing events or biological predisposition Could cause Low self esteem
Correlational Research • Pros: • Can measure the extent of a relationship • Cons: • Correlation is not causation (just because two things are related does not mean one causes the other)
Skewness (not in Myers) • Data can have a “skewness,” meaning it tends to have a long tail on one side or the other Negative Skew No Skew Positive Skew
Skewness Example – Frequency of Compliments and Self-Esteem • What type of skew does this data have? How do you know? • Write a summary statement for this graph’s data concerning the frequency of praise and performance. Performance
Experimental Methods Because many factors influence everyday behaviors/attitudes, psychologists need to isolate and control variables to establish cause and effect relationships. They do this using experiments.
Experiments • A research method in which an investigator manipulates one or more factors (independent variables) to observe the effect on some behavior or mental process (the dependent variable). By random assignment of participants, the experimenter aims to control other relevant factors. • Manipulate the factors of influence • Hold other variables constant • Unlike correlational studies that uncover naturally occurring relationships, an experiment manipulates a factor to determine its effect.
Variables – anything that can vary • Independent variable • The variable manipulated by the experimenter • Dependent variable • The outcome being studied as a result of the ind. variable • Ex: Hypothesis – Pill X can reduce the effects of heart disease. • Ind. - Pill X • Dep. – effects of heart disease • Mnemonic (memory aid): make a if-then statement “IF the independent variable THEN the dependent variable.”
Operational Definition (pg. 25) • Definition of the independent and dependent variables • Very specific especially when variables are vague • Ex: Hypothesis – Pill X can reduce the effects of heart disease. • Ind – Pill/drug • Operationalize: Pill X, placebo • Dep – effects on heart disease • Operationalize: beats per minute, cholesterol level
Research groups • Experimental group • Participants that receive the independent variable • Control group • Participants NOT exposed to the independent variable • Serves as a comparison for evaluating the effect of the ind. variable (sets a base-line) • Ex: Hypothesis – Pill X can reduce the effects of heart disease. Group A receives Pill X, while Group B receives a placebo (fake drug). • Exp. – Group A receiving Pill X (ind. variable) • Control – Group B receiving placebo
Placebos • RadioLab – Placebo (First 4ish minutes) • Placebo – a substance or treatment that has no effect apart from a person’s belief in it. • Placebo effect – a person receiving the placebo may report to positive effects due to a belief in the drug/treatment • Single blind study – participants do not know if they are in the experimental or control group • Double blind study – participants nor researchers know who is in the experimental or control group
Experiments • Pros: • Variables can be controlled and manipulated • Can determine cause-and-effect • Can be replicated • Cons: • Labs can not always duplicate real-life environments • Can be expensive
Isn’t this AP Psych, not AP Stats? • After gathering dating with research methods, it needs to be organized and summarized using statistics so we can make inferences about the data. • We make sense out of data using statistics.
Measures of Central Tendency • a single score that represents a whole set of scores/data • Mean – the average of the scores/values • Mode – the most frequent score/value • Median – the middle score /value in a distribution • Eg: Quiz scores – 60, 70, 70, 80, 80, 80, 80, 80, 90, 90, 100 • Mean: 80 • Mode: 80 • Median: 80
Measures in Variation • Allows us to see the variation or difference in a set of scores/values. • Range - the difference between the highest and lowest scores/values. • Standard deviation – a measure of how much scores/values vary around the mean. σ = Sum of (deviations)2 Number of scores
Range and Standard Deviation • Eg: Intelligence scores- 60, 70, 70, 80, 80, 80, 90, 90, 100 • Mean: 80 • Mode: 80 • Median: 80 • Range: 100-60 = 40 • The measure of dispersion of data • Standard Deviation: 12 • The degree to which scores differ from each other and vary around the mean value for the set (will always fall between 0 and ½ of range) • As the standard deviation approaches 0, the closer the scores are to each other. • As the standard deviation approaches ½ of range, the more dispersed the score are.
Mean, Median, Mode Standard Deviation = 12 points (how much scores vary from each and around the mean)
Normal Distributions • In a typical distribution of numbers, about 68% of all the scores will be within 1 standard deviation above or below the mean, and about 95% of all scores are within 2 standard deviation scores above or below the mean.
Mean, Median, Mode -1 to +1 St.Dev. = 77% Not a perfect distribution. -2 to +2 St.Dev. = 100%
Statistical Significance • a statistical statement of how likely it is that an obtained result occurred by chance. • Uses a fancy formula that we do not need to know… HOWEVER…