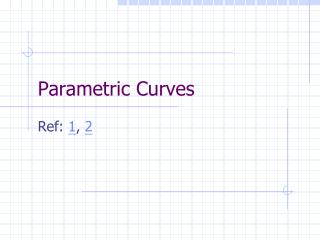
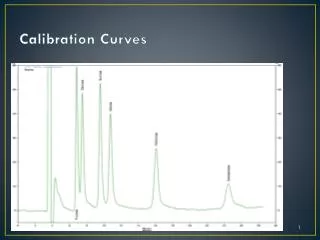
Calibration Curves
This document presents detailed calibration curves for measuring sugar concentrations ranging from 1000 to 5000 ppm in increments of 1000 ppm, utilizing linear, second-order polynomial, and logarithmic fits. It includes experimental results on M-sugars versus time at 63°C and discusses the application of first-order kinetic principles within a system of ordinary differential equations (ODEs). The document also explores enzyme kinetics through Michaelis-Menten mechanisms for hydrolysis of starch, presenting various sugars as products, and offers insights into reaction rates and assumptions for simplifications.

Calibration Curves
E N D
Presentation Transcript
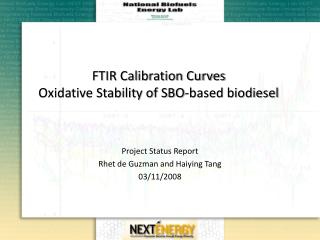
Calibration Curves • 1000 to 5000 ppm – Increments of 1000 ppm
Calibration Curves Linear Fit 2nd Order Polynomial Logarithmic Fit
Wort Carbohydrate Model @ 63°C Different Modeling Methods • 1st Order Kinetic Principles • System of ODE’s captures behavior • Doesn’t predict sugars based on proposed reaction kinetics • Monte-Carlo Probability • “Overkill” • Michaelis-Menten Enzyme Kinetics • Based on Substrate and Enzyme Concentrations
Michaelis-Menten Enzyme Kinetics General Reaction Rate: E + S E-S E + P E – Enzyme S – Substrate E-S – Enzyme-Substrate Complex P - Product k1 k2 k-1
Notes On Board Pause
Proposed Hydrolysis Mechanism • Products: • M1 - Mono-Saccharides (Fructose, Dextrose) • M2 - Di-Saccharides (Sucrose, Maltose) • M3 -Tri-Saccharides (Malto-Triose) • M4 - Tetra-Saccharides (Malto-Tetraose) • M>4 - Oligosaccharides (Higher Order Sugars) • D - Dextrins • Enzymes: • β - Beta Amylase • α - Alpha Amylase • Substrate: • Starch • AP - Amylopectin • A - Amylose Eβ + AP Eβ –AP Eβ + M1 + M2 + D + M>4 Eβ + A Eβ –A Eβ + M1 + M2 + D + M>4 Eα + AP Eα–AP Eα + M1 + M2+ M3+ M4 + M>4 + D Eα + A Eα–A Eα+ M1 + M2 + M3 + M4 + M>4 + D
Assumptions/Simplifications • Inability to distinguish between αand βInitial Concentrations: • Eα + Eβ = E • Inability to distinguish between AP and A Starch • Both Starches lead to same products • AP + P = S • Dextrin Formation is negligible wrtSugars’s • dD/dt = 0 • Starch hydrolysis is to completion • No [A] or [AP] left over in products • Ie: Everything is converted to Higher Order Sugars
Simplified Model k2 E + M1 kf k3 E + M2 E + S E–S kb k4 E + M3 k5 E + M4 k6 E + M>4 Species Rates: Reaction Rates: rE= -r1 + r2 + r3+ r4+ r5+ r6 r1= kf[E][S] - kb[ES] rS= -r1 r2= k2[ES] rES= r1 -r2 - r3- r4- r5 - r6 r3= k3[ES] rM1= r2 r4= k4[ES] rM2= r3 r5= k5[ES] rM3= r4 r6= k6[ES] rM4= r5 rM>4= r6
Simplified Model: Quasi-Steady State • QSS on formation of [ES] complex • This reaction intermediate formation is negligible wrt other system rates • d[ES]/dt = 0 • Plug in Rate Laws: Solve for E • Apply Enzyme Balance: [E] = [Eo] – [ES] • Solve for [ES] rES= 0 = r1 -r2 - r3- r4- r5 - r6 r1 = r2 + r3 + r4 + r5 + r6
Solving Where,
Getting Km and Vmi • Hanes-Woolf Plot • • Plot vs [S] • Slope = int =