Download
1 / 28
280 likes | 445 Views
Simulations of Large Earthquakes on the Southern San Andreas Fault Amit Chourasia Visualization Scientist San Diego Supercomputer Center Presented to: Latin American Journalists July 11, 2007. Global Seismic Hazard. Source: Global Seismic Hazard Assessment Program. Increasing Loss.

E N D
Simulations of Large Earthquakes on the Southern San Andreas Fault Amit Chourasia Visualization Scientist San Diego Supercomputer Center Presented to: Latin American Journalists July 11, 2007
Global Seismic Hazard Source: Global Seismic Hazard Assessment Program
Increasing Loss Growth of Earthquake Risk Expansion of urban centers in tectonically active areas is driving an exponential increase in earthquake risk. Growth of cities 2000-2015 Source: National Geographic Slide: Courtesy Kim Olsen
Faulting, shaking, landsliding, liquifaction Extent & density of built environment Structural vulnerability Risk Equation Risk = Probable Loss (lives & dollars) = Hazard Exposure Fragility Slide: Courtesy Kim Olsen
(http://geohazards.cr.usgs.gov/eq/) Seismic Hazard Analysis Definition: Specification of the maximum intensity of shaking expected at a site during a fixed time interval Example: National seismic hazard maps • Intensity measure: peak ground acceleration (PGA) • Interval: 50 years • Probability of exceedance: 2% Slide: Courtesy Kim Olsen
The FEMA 366 Report “HAZUS’99 Estimates of Annual Earthquake Losses for the United States”, September, 2000 • U.S. annualized earthquake loss (AEL) is about $4.4 billion/yr. • For 25 states, AEL > $10 million/yr • 74% of the total is concentrated in California • 25% is in Los Angeles County alone Slide: Courtesy Kim Olsen
Southern California: a Natural Laboratory for Understanding Seismic Hazard and Managing Risk • Tectonic diversity • Complex fault network • High seismic activity • Excellent geologicexposure • Rich data sources • Large urban population with densely built environment high risk • Extensive research program coordinated by Southern California Earthquake Center (SCEC) under NSF and USGS sponsorship Slide: Courtesy Kim Olsen
1994 Northridge When: 17 Jan 1994 Where: San Fernando Valley Damage: $20 billion Deaths: 57 Injured: >9000 Slide: Courtesy Kim Olsen
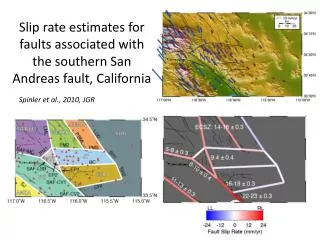
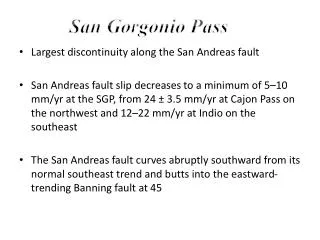
Major Earthquakes on the San Andreas Fault, 1690-present Slip deficit on the southern SAF since last event (1690):315 years x 16 mm/year = 5.04 m -> Mw7.7 146+91-60 yrs 220±13 yrs 1906 M 7.8 ~1690 M 7.7 1857 M 7.9 Slide: Courtesy Kim Olsen
TeraShake Simulation Region • 600km x 300km x 80km • Spatial resolution = 200m • Mesh Dimensions • 3000 x 1500 x 400 = 1.8 billion mesh points • Simulated time = 4 minutes • Number of time steps = 22,728 (0.011 sec time step) • 60 sec source duration from Denali • 3D Crustal structure: subset of SCEC CVM3.0 • Near-surface S-wave velocity truncated at 500m/s, up to 0.5 Hz
TeraShake-2 Data Flow Okaya 200m Media Initial 200m Stress modify TS2.dyn.200m 30x 256 procs, 12 hrs, Initial 100m Stress modify SDSC IA-64 TG IA-64 GPFS Okaya 100m Media TS2.dyn.100m 10x 1024 procs, 35 hrs TG IA-64 GPFS-wan NCSA IA-64 GPFS NCSA-SAN Network 100m Reformatting 100m Transform 100m Filtering 200m moment rate SDSC-SAN Datastar GPFS TS2.wav.200m 3x 1024 procs, 35 hrs Datastar p690 Velocity mag. & cum peak Displace. mag & cum peak Seismograms Datastar p655 HPSS SRB SAM-QFS Visualization Analysis Registered to Digital Library Slide: Courtesy Yifeng Cui
Before Optimization Code deals up to 24 million mesh nodes Code scales up to 512 processors Ran on local clusters only No checkpoints/restart capability Wave propagation simulation only Researcher’s own code Mesh partition and solver in one Initialization not scalable, large memory need I/O not scalable, not portable After Optimization Codes enhanced to deal with 32 billion mesh nodes Excellent speed-up to 40,960 processors, 6.1 Tflop/s Ported to p655, BG/L, IA-64, XT3, Dell Linux etc Added Checkpoints/restart/checksum capability Integrated dynamic rupture + wave propagation as one Serve as SCEC Community Velocity Model Mesh partition separated from solver 10x speed-up of initialization, scalable, memory reduced MPI-I/O improved 10x, scaled up to 40k processors Challenges for Porting and Optimization Slide: Courtesy Yifeng Cui
Data from TeraShake 1.1 Aggregate Data : 160 TB (seven simulations)
Visualization Movie(1.5 mb)
Comparative Visualization Movie(11 mb)
Scenario Comparison PGV (NW-SE Rupture) PGV (SE-NW1 Rupture)
Topography Deformation Movie(11 mb)
Glimpse of Visualization Movie(65 mb)
Visualization • Over 130,0000 images • Consumed 40,000 hrs of compute time • More than 50 unique animations
TeraShake Results TeraShake-1 TeraShake-2 • NW-directed rupture onsouthern San Andreas Fault is highly efficient in exciting L.A. Basin • Maximum amplification from focusing associated with waveguide contraction • Peak ground velocities exceeding 100 cm/s over much of the LA basin • Uncertainties related to simplistic source description. • Extremely nonlinear dynamic rupture propagation • Effect of 3D velocity structure: SE-NW and NW-SE dynamic models NOT interchangeable • Stress/strength/tapering - weak layer required in upper ~2km to avoid super-shear rupture velocity • Dynamic ground motions: kinematic pattern persists in dynamic results, but peak motions 50-70% smaller than the kinematic values due to less coherent rupture front Slide: Courtesy Yifeng Cui
Summary • TeraShake demonstrated that optimization and enhancement of major applications codes are essential for using large resources (number of CPUs, number of CPU-hours, TBs of data produced) • TeraShake showed that multiple types of resources are needed for large problems: initialization, run-time execution, analysis resources, and long-term collection management • TeraShake code as a community code now used by the wider SCEC community • Significant TeraGrid allocations are required to advance the seismic hazard analysis to a more accurate level • Next: PetaShake! Slide: Courtesy Yifeng Cui
References • Chourasia, A., Cutchin, S. M., Olsen, K.B., Minster, B., Day, S., Cui, Y., Maechling, P., Moore, R., Jordan, T. (2007) “Visual insights into high-resolution earthquake simulations”, IEEE Computer Graphics & Applications (Discovering the Unexpected) Sept-Oct 2007, In press. • Cui, Y., Moore, R., Olsen, K., Chourasia, A., Maechling, P., Minster. B., Day, S., Hu, Y., Zhu, J., Majumdar, A., Jordan, T. (2007), Enabling very-large scale earthquake simulations on parallel machines "Advancing Science and Society through Computation", International Conference on Computational Science 2007, Part I, Lecture Notes in Computer Science series 4487, pp. 46-53, Springer • Olsen, K.B., S.M. Day, J.B. Minster, Y. Cui, A. Chourasia, M. Faerman, R. Moore, P. Maechling, and T. Jordan (2006). Strong shaking in Los Angeles expected from southern San Andreas earthquake, Geophys. Res. Lett. 33, L07305,doi:10.1029/2005GRL025472
TeraShake Collaboration Large Scale Earthquake Simulation on Southern San Andreas 33 researchers, 8 Institutions • Southern California Earthquake Center • San Diego Supercomputer Center • Information Sciences Institute • Institute of Geophysics and Planetary Physics (UC) University of Southern California • San Diego State University • University of California, Santa Barbara • Carnegie-Mellon University • ExxonMobil Slide: Courtesy Marcio Faerman
Acknowledgements • Southern California Earthquake Center (SCEC) • San Diego Supercomputer Center (SDSC) • Funding: National Science Foundation
Thanks for your patience Q&A Websites: http://www.sdsc.edu/us/sac (Computation) http://epicenter.usc.edu/cmeportal/TeraShake.html (Seismology) http://visservices.sdsc.edu/projects/scec/terashake (Visualization)