Download
1 / 28
280 likes | 281 Views
This study explores the implications of near-source observations of earthquakes on earthquake rupture and fault mechanics. It examines data collected from deep geophysical observatories in California, including the San Andreas Fault Observatory at Depth (SAFOD) and the Long Valley Exploratory Well (LVEW). The study investigates stress drops, spectral ratios, dynamic stress drops, and other factors related to earthquake behavior.

E N D
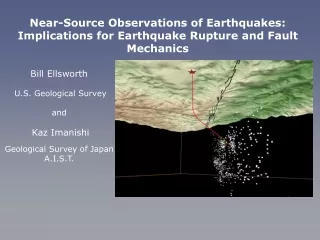
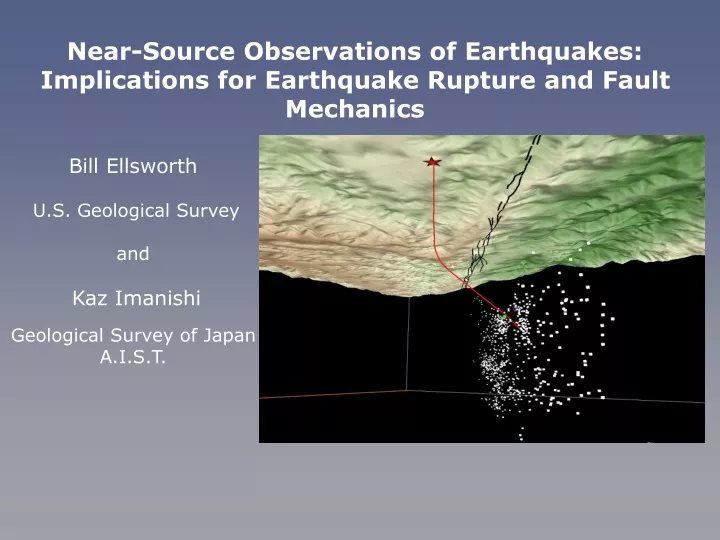
Near-Source Observations of Earthquakes: Implications for Earthquake Rupture and Fault Mechanics Bill Ellsworth U.S. Geological Survey and Kaz Imanishi Geological Survey of Japan A.I.S.T.
Deep Geophysical Observatories in California San Andreas Fault Observatory at Depth (SAFOD) 2.7 km deep Long Valley Exploratory Well (LVEW) 2.7 km deep
Analog 4.5 Hz seismometer digitized at surface (500 samples/s) Earthquakes at 300 m distance to seismometer in LVEW with magnitudes as small as Mw -2.5 Seconds
Digital 15 Hz seismometer with optical fiber transmission to surface at 4000 samples/sInstalled at 2.7 km depth, 120 C May 2006 multiplet occurred at distance of about 600 m (S-P time is 0.1 s). Spectrogram of M1.12 event M1.12 M1.25 4000 samples/s 0.1 s • High signal-to-noise ratio • High frequency energy is observed.
Sato & Hirasawa (1973) Eshelby (1957) Static Stress Drop Mw: 0.38 and 0.11 Multi-Window Spectral Ratio Method (Imanishi & Ellsworth, 2006) • Stress drops range from approximately 1 to 100 MPa. • For any given cluster, the stress drops are nearly constant within a factor of 2-3.
Aftershocks of M1.8 “Hawaii” Target (August 11, 2006) • Corner frequencies of these events are beyond the frequency band • Or all the events have the same corner frequency Spectral ratios relative to EV1 Mw –2.1 Mw –2.7 Mw –2.5 Mw –2.6 Spectral ratios are almost constant. Mw –2.6
Stress Drop Scaling The existence of picoearthquake implies lab-like values for Dc
Apparent Stress Scaling (Radiated Energy / Seismic Moment) Ide and Beroza (2001) SAFOD Pilot Hole Apparent Stress Measurements (Imanishi and Ellsworth, 2006)
Dynamic Stress Drop Kostrov (1964) solution for a growing circular crack: sD = rvp3rü /(kvr2Vs)
Some events begin simply, while others have a nucleation phase. Dynamic Stress Drop Kostrov (1964) solution for a growing circular crack: sD = rvp3rü /(kvr2Vs) 1.1 MPa 3.2 MPa 5.0 MPa 2.2 MPa
August 11, 2006 M 1.8 Hawaii Repeat Seismometer at 2.65 km depth at a distance of 120 m
Dynamic Stress Drop in Initial Millisecond sD = rvp3rü /(kvr2Vs) Dynamic Stress Drop = 4 – 7 MPa
Critical Dimension for Instabilityin Rate & State Theoryh* = G Dc /(s-P0)(b-a) Laboratory August 11, 2006 “Hawaii” M 1.8 at 0.5 ms.
Permanent Monitoring Array Instrumentation Design goals • Record weak motion at the maximum gain consistent with high signal-to-noise in the 10 – 2000 Hz band. • Record on scale motion of M 2 earthquakes in their near field over a broad band (0.5 – 1500 Hz). • Maintain linearity of ground motion recording in the sensor, electronics and mechanical coupling to the Earth. • Record aseismic transient deformation at periods from 1 hour (or longer) to 1 s. • Record pore pressure fluctuations in the fault zone at periods of days to 1 s.
SAFOD Observatory • Pipe deployed system • Electrical conductors and optical fibers in stainless steel microtubes. • No O-rings (laser welded sondes) • Stiff bow spring decentralizers on instrument pods • 3 levels of multi-component sondes • GERI DS150 3C 15 Hz seismometer • Modified GERI DS150 with 3C Colibrys MEMS accelerometer • Pinnacle borehole tiltmeter • Optical fiber telemetry (4K sps) • GERI Geores control computer • USGS Earthworm data distribution and archiving system • On-site event detection and integration of SAFOD, HRSN and NCSN waveforms using Norsar MIMO system • Pinnacle Technologies borehole tiltmeter • Optical fiber strainmeter deployed behind casing in vertical section of main hole (M. Zumberge, UCSD) • Pore pressure and packer not installed due to hole conditions
SAFOD Seismic Sensors Commercial high-frequency borehole seismometers (Oyo Geospace DS150 – 150 C rating) MEMS accelerometers replace geophones for broad band response
Cable Head Seismometer MEMS accelerometer Tiltmeter Tiltmeter Seismometer MEMS accelerometer Seismic tool carrier Tiltmeter tool carrier 11 mm polypropylene control line containing ¼” SS tube with fiber and electrical conductors 11 mm polypropylene control line containing ¼” SS tube with coax 2 3/8” EUE tubing 3/8” SS tube containing electrical conductors EUE/CS crossover sub 1 ¼” CS tubing crossover sub EM tool carrier Seismometer MEMS accelerometer EM coil
Tool Carrier Assembly Pressure testing tool carrier Gas-tight threads on endcaps (NPT-type) Metal-metal seals on control lines Low melting point metal (138 C) used to rigidly attach instruments to tool carrier Tool carrier filled with ceramic proppant and synthetic oil
Installation of the Observatory Instrument Pod and Control Line Small Drill Rig
Analog Seismometerwith high temperature (200 C) 15 Hz geophones(Institue of Earth Science and Engineering, University of Auckland, New Zealand) Steve and Bill filling the cable head with high-temperature epoxy 1.6” OD 2x 15 Hz geophones/component drives 3 km cable
Conclusions • Stress Drop and Apparent Stress are scale-invariant for Mw>0. We do not as yet have measurements for smaller earthquakes. • The dynamic stress drops in the first 1-2 ms (rupture dimension ~2-4 m) are typically in the range from 1 – 10 MPa and are comparable to the event stress drops. • Earthquakes as small as Mw -3.5 (picoearthquakes) occur along the San Andreas Fault at SAFOD and in Long Valley Caldera. If there is a minimum earthquake magnitude, we have not yet seen it. • Lab values of Dc are consistent with the occurrence of picoearthquakes at SAFOD. • The August 11, 2006 Mw 1.8 “Hawaii” earthquake began without a Slow Initial Phase and has (b-a) ~ 0.01.