Download
1 / 10
100 likes | 116 Views
Learn how to graph and write absolute value functions and apply transformations. Identify intercepts, zeros, intervals of increase and decrease. Compare graphs and apply symmetry.

E N D
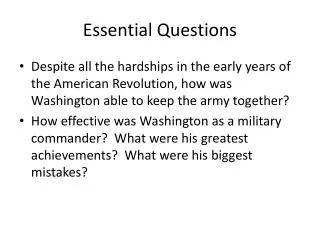
Friday, September 3 Essential Questions • How do I graph and write absolute value functions?
2.4 Use Absolute Value Functions and Transformations Graph a function of the form . Example 1 Graph . Identify the intercepts, zeros, and intervals of increase and decrease. Compare the graph with the graph . • Identify and plot the vertex, • Plot another point on the graph such as Use symmetry to plot a third point, • Connect the points with a ____________ graph. V-shaped • Examine the graph. The x-intercepts are ____ and ____, which are also the _______ of the function, and the y-intercept is ____. The function is increasing when _________ and decreasing when ________. zeros
2.4 Use Absolute Value Functions and Transformations Graph a function of the form . Example 1 Graph . Identify the intercepts, zeros, and intervals of increase and decrease. Compare the graph with the graph . • Compare with . The graph of is the graph of first stretched __________ by a factor of ___, then reflected in the _______, and finally translated ________ units and ________ units. vertically left 3 x-axis up 2
2.4 Use Absolute Value Functions and Transformations Checkpoint. Complete the following exercise. • Graph the function . Compare the graph with the graph . Vertical shrink with scale factor of ½. Reflect over the x-axis. Translated right 1 and down 2. Increasing x < 1 Decreasing x > 1
2.4 Use Absolute Value Functions and Transformations Write an absolute value function. Example 2 Write a function for the graph shown. Solution The vertex of the graph is ( ___, ___ ). So, the equation has the form Substitute the coordinates of the point ( ___, ___ ) into the equation and solve for a. Substitute for x and for y. Solve for a. An equation for the graph is y = _______________
2.4 Use Absolute Value Functions and Transformations Checkpoint. Write a function for the graph shown.
2.4 Use Absolute Value Functions and Transformations Apply transformations to a graph Example 3 The graph of a function y = f(x) is shown. Sketch the graph of the given function. Solution • The graph of is the graph of shrunk _________ by a factor of ____. vertically ½ ½ To draw the graph, find ___ y for each labeled point ( x, y ) on the graph of f(x). Plot the points ( x, __ y ) and connect them. ½
2.4 Use Absolute Value Functions and Transformations Apply transformations to a graph Example 3 The graph of a function y = f(x) is shown. Sketch the graph of the given function. Solution • The graph of is the graph of _________ in the x-axis, then translated _______ unit and ______ units. reflected right 1 up 2 To draw the graph, first reflect the labeled points then translate and connect their images.
2.4 Use Absolute Value Functions and Transformations Checkpoint. Use the graph of f(x) in Example 3 to graph the given equation.
2.4 Use Absolute Value Functions and Transformations Pg. 44, 2.4 #1-24