State Estimates of Child Care Establishments: 1977 - 1997
State Estimates of Child Care Establishments: 1977 - 1997. Grace E. O’Neill and Martin O’Connell. Source: 1977 - 1997 Census of Service Industries. Census of Service Industries:.

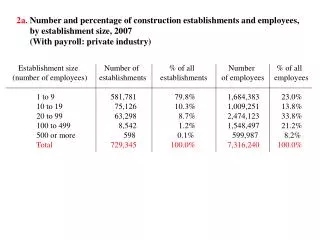
State Estimates of Child Care Establishments: 1977 - 1997
E N D
Presentation Transcript
State Estimates of Child Care Establishments: 1977 - 1997 Grace E. O’Neill and Martin O’Connell Source: 1977 - 1997 Census of Service Industries
Census of Service Industries: Collects Data every five years on child care establishments which file Federal Income Tax Forms. They are classified into three types of establishments: 1. Nonemployer businesses (e.g., individual proprietorships, partnerships). Data available beginning in 1987 2. Establishments with an employee payroll that pay income taxes (e.g., a child care center for profit). 3. Establishments with an employee payroll that are tax-exempt (e.g., a non-profit based center).
Historical Trends in Child Care Establishments 1. The vast majority of child care establishments in 1997, as in previous years, were the nonemployer business. In 1997 there were 550,788 child care establishments, of which 488,734 were nonemployer businesses. 2. Economically, the child care workers fared very poorly over the past 20 years. The average payroll* per employee in 1997 was $11,076, $548 less than it was in 1977. The increase for all female wage earners in the period was from $12,681 to $16,849. Child care workers suffered very heavily during the high inflation period of the late 1970’s. * All figures are in constant 1997 dollars
Trends in Types of Establishments 550,788 540,351 262,511
Payroll per Employees and Median Wage and Salary Income of Female Workers in 1997 Dollars 1997 Dollars Note: Wage and Salary data are from the Current Population Survey.
Correlates of Child Care Establishments 1. Using 1990 Census data, selected indicators of child care demand and potential supply factors were obtained for all 50 States. 2. Correlations between total establishments per 1,000 children under five years for 1992 were made with the 1990 Census data.
What Factors are Related to State Variations on the Number of Child Care Establishments per 1,000 Children under five? - States which have high female labor force participation rates are also those with high ratios of child care establishments per 1,000 children - Potential alternative suppliers of child care assistance may lessen the need for more formal child care centers and providers. Lower establishment per child ratios are found in states which have:
High Proportion of foreign born workers who may be available for household employment High proportion of women working as private household workers High proportion of children living in poverty whose families may not be able to afford to pay for child care High proportion of teenagers not in school or with a job High proportion of households with other adult relatives who are potentially available to serve as child care providers
Correlation of Rates per 1,000 Children by Select Indicators Indicators Correlation Statistics Women in Labor Force 0.55780* Population Foreign Born -0.42612* Employed Female in -0.26137** Private Household Occupations Families with Related -0.25143** Children Under five in Poverty 16 to 19 year old not -0.69302* Enrolled in School or in the Labor Force Household with Related -0.75495* Adult Members * Significant at the 0.05 Level ** Significant at the 0.10 Level
State and Regional Variation in Child Care Establishments 1. There are many different types of arrangement families use to care for their preschoolers. 1997 data indicates that child care centers are more available in the Midwest and Central states. North Dakota had the highest ratio of establishments per 1,000 children for all years between 1987-1997. 2. In general, child care centers seem less available to families in the South, but also in some Northern states, especially New York and New Jersey. 3. Factors such as ability of families to pay for child care and the availability of in-home workers, as shown in the previous section, can account for regional variations in the supply of child care center establishments.
Establishment Types per 1,000 Children Under Five: 1997 (Includes Establishments with and without payroll) Number of Establishments per 1,000 Children
Establishment Types per 1,000 Children Under Five: 1992 (Includes Establishments with and without payroll) Number of Establishments per 1,000 Children
Establishment Types per 1,000 Children Under Five: 1987 (Includes Establishments with and without payroll) Number of Establishments per 1,000 Children
Changes in Child Care Establishments, 1987 - 1997 1. Overall, the ratio of child care establishments per 1,000 children under five years doubled from 15 per 1,000 in 1987 to 29 per 1,000 in 1997. 2. Most of the increase occurred among nonemployer businesses, from 12 per 1,000 in 1978 to 26 per 1,000 in 1997. 3. While all States experienced net increases per 1,000 for 1987-1992, only 58 percent of States continued experiencing net increase per 1,000 between 1992-1997. 4. While these data do not reflect on the quality of the care being provided, they do point to the significant imbalance in these types of center based arrangements available to families in different areas of the country.
Ratio of Child Care Establishments per 1,000 Children Under Five 29 28 15
Net Increase in Establishments per 1,000 Children Under Five: 1987-1997 (Includes Establishments with and without payroll)
Net Increase in Establishments per 1,000 Children Under Five: 1992-1997 (Includes Establishments with and without payroll) Total Growth