Download
1 / 70
700 likes | 732 Views
Explore the interrelationship between theory and research in education, understanding the role of theory in prediction, summarization, and knowledge gap identification. Delve into epistemological and ontological considerations to enhance educational research methodologies.

E N D
EDP 201: Research Methodology. SOKOINE UNIVERSITY OF AGRICULTURE FACULTY OF SCIENCE DEPARTMENT OF EDUCATION
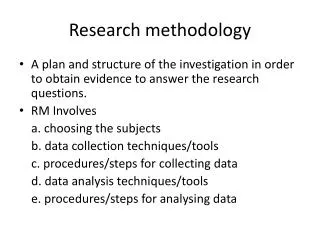
Module 2: Educational research strategies 2.1. Theory and research • A theory is a set of interrelated concepts, definitions, and propositions that explains or predicts events or situations by specifying relations among variables. • A theory is a generalization about a phenomenon or behaviour, an explanation of how or why something or behavior occurs. Functions (Role) of Theory • Theory as orientation: Theoretical system narrows the range of facts to be studied. Any phenomenon or object may be studied in many different ways.
Theory as a conceptualization and classification. Theory provides the relationship between concepts which are stated in "the facts of science." • Theory in summarizing role. The theory summarizes concisely what is already known about the object of study, through (1) empirical generalizations, and (2) systems of relationships between propositions. • Theory predicts facts. The theory summarizes facts and states a general uniformity beyond the immediate observation, it also becomes a prediction of facts. The most obvious face of prediction is the extrapolation from the known to the unknown. • Theory points gaps in knowledge. Since theory summarizes the known facts and predicts facts which have not been observed, it must also point to areas which have not yet been explored.
Role of Facts (Research) Theory and fact are in constant interaction. Developments in one may lead to developments in the other. • Facts initiate theory. Science(research) lead to important formulation of theories. This is what the public thinks of as a "discovery." • Facts lead to the rejection and reformulation of existing theory. Since research is continuing activity, rejection and reformulation are likely to be going on simultaneously. • Facts redefine and clarify theory. New facts that fit the theory will always redefine the theory, for they state in detail what the theory states in very general terms. They clarify that theory, for they throw further light upon its concepts.
Theory and Research: the dynamism • Theory and research are interrelated. The value of theory and its necessity for conducting good research should be clear. Researchers who proceed without theory rarely conduct top-quality research and frequently find themselves in confusion. Likewise, those who proceed without linking theory to research are in jeopardy of floating off into incomprehensible speculation and conjecture (assumption).
2.2. Epistemological and ontological considerations Ontology is a branch of philosophy (metaphysics) concerned with the nature and relations of being (reality). It is a particular theory about the nature of being or the kinds of existents (Wand and Weber, 1993:220). It is about the nature and structure of the world. The ontological questions • What is the form and nature of reality (what is reality?) • What is there that can be known about it? • What are the characteristics of things that exist? . For example, if someone has a positivist view of the world, the ontological assumptions would be based on the existence of social phenomena independent of our perceptions and values. From this perspective everything in the social world would be meaningless and would exist in the same way as physical objects.
b) Epistemology is therefore the relationship between the researcher and the reality (Carson et al., 2001) or how this reality is captured or known. The epistemological questions • What is the nature of the relationship between the knower and what can be known? • What Constitutes Valid Knowledge and How Can We Obtain It? • 'How do we acquire knowledge?' "How do we know what we know? There are two dominant ontological and epistemological traditions or ideologies: 1) Positivism, 2) Interpretivism.
Why are Ontology and Epistemology important? • Ontology precedes epistemology: Whenever we do research on a social phenomenon, we would have to start with some ontological views about how reality exists, and those views, beliefs would subsequently lead us to some sort of knowledge. • According to how we will perceive the existence of the world, our search for knowledge will follow a certain path (method). The ontological and epistemological considerations are our starting point to study a certain topic. • While ontology refers to the nature of knowledge and reality, epistemology concerns the very basis of knowledge-whether this is hard, real, and transmittable in a concrete form, or whether it is softer and more subjective, based on personal experience and insight (Cohen, Manion and Morrison, 2006).
Epistemology raises many questions including the relationship between the knower and what is known, the characteristics, the principles, the assumptions that guide the process of knowing and the achievement of findings.
Module 3: The quantitative research approach 3.1. Philosophical underpinnings Positivism (scientific paradigm) • The ontological position of positivism is one of realism. Realism is the view that objects have an existence independent of the knower (Cohen et al., 2007, p. 7). Thus, most positivists assume that reality is not mediated by our senses. • The positivist epistemology is one of objectivism. Positivists go forth into the world impartially, discovering absolute knowledge about an objective reality. The researcher and the researched are independent entities.
Positivists usually use quantitative methods as research tools, as these are objective and the results generalizable and replicable. They look for explanation of behaviour, not for the meaning. • Positivist methodology is directed at explaining relationships. Positivists attempt to identify causes which influence outcomes (Creswell, 2009, p. 7). Their aim is to formulate laws, thus yielding a basis for prediction and generalization. Thus, a deductive approach is undertaken. Correlation and experimentation are used to reduce complex interactions their constituent parts. Verifiable evidence sought via direct experience and observation.
The Interpretive Paradigm • The ontologicalposition of interpretivism is relativism. Relativism is the view that reality is subjective and differs from person to person (Guba & Lincoln, 1994, p. 110). Our realties are mediated by our senses. Reality is individually constructed; there are as many realities as individuals. • The interpretiveepistemology is one of subjectivism which is based on real world phenomena. Knowledge and meaningful reality are constructed out of interaction between humans and their world.
Interpretive methodology is directed at understanding phenomenon from an individual’s perspective, investigating interaction among individuals as well as the historical and cultural contexts. It generates qualitative data. • It uses inductive process that is qualitative in nature. The interpretivism uses inductive reasoning, starting from specific observations that is repeated and then drawing a general conclusion based on these; thus, moving from the particular to the general
3.2. Research designs • Quantitativeresearch is a anobjective, systematic process for obtaining information about the world by collecting quantitative data through statistical analysis. The goal of quantitative research is to test relationships, describe, examine cause and effect relations • Research design is the structure of any scientific work. It gives direction and systematizes the research process from formulating research question to the conclusion of the process. • True- experimental design • It is the most accurate form of experimental research, which attempts to prove or disprove a hypothesis mathematically, with statistical analysis. Its purpose is to determine cause and effects. For an experiment to be classed as a true experimental design, it must fit all of the following criteria.
The sample groups must be assigned randomly. • There must be a viable control group. • Only one variable can be manipulated and tested. It is possible to test more than one, but such experiments and their statistical analysis tend to be cumbersome and difficult. • The tested subjects must be randomly assigned to either control or experimental groups. Advantages of experimental research • The results of a true experimental design can be statistically analyzed and so there can be little argument about the results. • It is also much easier for other researchers to replicate the experiment and validate the results.
For physical sciences working with mainly numerical data, it is much easier to manipulate one variable, so true experimental design usually gives a yes or no answer. Disadvantages of experimental research • Firstly, they can be almost too perfect, with the conditions being under complete control and not being representative of real world conditions. • Secondly, there can be never be any guarantee that a human or living organism will exhibit ‘normal’ behavior under experimental conditions. • True experiments can be too accurate and it is very difficult to obtain a complete rejection or acceptance of a hypotheses because the standards of proof required are so difficult to reach.
True experiments are also difficult and expensive to set up. They can also be very impractical. • While for some fields, like physics, there are not as many variables so the design is easy, for social sciences and biological sciences, where variations are not so clearly defined it is much more difficult to exclude other factors that may be affecting the manipulated variable. Quasi- experimental design • Quasi-experimental design is a form of experimental research used extensively in the social sciences and psychology. The method is, nevertheless, a very useful method for measuring social variables. • It involves selecting groups, upon which a variable is tested, without any random pre-selection processes. For example, to perform an educational experiment, a class might be arbitrarily divided by seating arrangement.
Advantages of quasi-experimental research • Especially in social sciences, where pre-selection and randomization of groups is often difficult, they can be very useful in generating results for general trends. E.g. if we study the effect of maternal alcohol use when the mother is pregnant. This would be highly illegal because of the possible harm the study might do to the embryos. • Quasi-experimental design is often integrated with individual case studies; the figures and results generated often reinforce the findings in a case study, and allow some sort of statistical analysis to take place. • In addition, without extensive pre-screening and randomization needing to be undertaken, they do reduce the time and resources needed for experimentation.
Disadvantages of quasi-experimental research • Without proper randomization, statistical tests can be meaningless. For example, these experimental designs do not take into account any pre-existing factors (as for the mothers: what made them drink or not drink alcohol), or recognize that influences outside the experiment may have affected the results. • Due to lack of researcher control, a quasi experiment can produce the results which will not stand up to rigorous statistical scrutiny because the researcher also needs to control other factors that may have affected the results. This is really hard to do properly. • One group of children may have been slightly more intelligent or motivated. Without some form of pre-testing or random selection, it is hard to judge the influence of such factors.
Non-experimental designs Correlational research design • A correlational study determines whether or not two variables are correlated or related. This means to study whether an increase or decrease in one variable corresponds to an increase or decrease in the other variable. There are three types of correlations that are identified: • Positive correlation: Positive correlation between two variables is when an increase in one variable leads to an increase in the other and a decrease in one leads to a decrease in the other. For example, the amount of money that a person possesses might correlate positively with the number of cars he owns.
Negative correlation is when an increase in one variable leads to a decrease in another and vice versa. For example, the level of education might correlate negatively with crime. This means if by some way the education level is improved in a country, it can lead to lower crime.. • No correlation: Two variables are uncorrelated when a change in one doesn't lead to a change in the other and vice versa. For example, if happiness is found to be uncorrelated to money. This means an increase in money doesn't lead to happiness. A correlation coefficient is usually used during a correlation study. It varies between +1 and -1. A value close to +1 indicates a strong positive correlation while a value close to -1 indicates strong negative correlation. A value near zero shows that the variables are uncorrelated.
Limitations • It is very important to remember that correlation doesn't imply causation and there is no way to determine or prove causation from a correlational study. This is a common mistake made by people in almost all spheres of life. Descriptive research design • This is a scientific method which involves observing and describing the behaviour of a subject without influencing it in any way. Thus, descriptive research design allows observation without affecting normal behaviour
Advantages of descriptive research design • The subject is being observed in a completely natural and unchanged natural environment. • Descriptive research is often used as a pre-cursor to quantitative research designs, the general overview giving some valuable pointers as to what variables are worth testing quantitatively. • It gives researcher an opportunity to use both quantitative and qualitative data in order to find data and characteristics about the population or phenomenon. • Data collected for descriptive research can provide a very multifaceted approach. Data can include case studies (which provide more personal account0; observations and surveys (which can give statistics)
Disadvantages of descriptive research design • Because there are no variable manipulated, there is no way to statistically analyze the results. Pre-existing differences may be a plausible alternative explanation for any observed differences on the dependent variable of interest. • The observed results are not repeatable, and so there can be no replication of the experiment and reviewing of the results. • Descriptive research design is weak in its ability to reveal causal relationships • Objectivity and errors; there is a possibility of errors and subjectivity. For example researcher may records what he wants to hear and ignore data which does not conform to his research hypotheses.
Causal-comparative research Causal-comparative research attempts to establish cause-effect relationships among the variables of the study. It attempts to determine the cause or consequences of differences that already exist between or among groups of individuals. • An independent variable is identified but not manipulated by the experimenter. • The researcher does not randomly assign groups and must use ones that are naturally formed or pre-existing groups
For example, a researcher measured the mathematical reasoning ability of young children who had enrolled in Montessori schools and compared the scores with a group of similar children who had not been to Montessori schools Advantages of causal-comparative research • Causal-comparative research design can be defined as a research that permits researchers to study naturally occurring, cause and effect relationship through comparison of data from participant groups who exhibit the variables of interest • Uncovers relationships to be investigated experimentally. • Used to establish cause-effect when experimental design not possible. • Less expensive and time consuming than experimental research.
Casa-comparative allows us to study cause-and effect relationship under conditions where experimental manipulation is difficult or impossible. Therefore socially and ethically relevant. • Many relationships can be studied in a single research study. For example, students socio-economic background and gender on their academic achievement. • Less expensive and time consuming than experiments Limitations of causal-comparative research • Subject Characteristics • It is difficult in finding or creating Homogeneous Subgroups • Researcher has limited control over the study and thus, extreme caution must be applied in interpreting results. The 3rd variable may affect the results.
3.3. Problem formulation and development of hypotheses • The formulation of a research problem is the first and most important step of the research process. This is more like identifying a destination prior to beginning a journey. • Problem formulation can be a question or something you are wondering about. • It should be something you can solve or give answers to • A conclusion in report is always the answer to the problem formulation There are different types of problem formulation • The descriptive problem formulation- always describes the problem (What). For example “ A school has trouble integrating new employees/teachers.
So problem formulation could be [What kind of the problems appear for the school and the employees in the beginning of the employment?] Why It is the explanatory problem formulation- itwants to explain a problem. For example, why does it seem that the employees/teachers have trouble adapting the culture in the school? How It is the normative problem formulation- ittries to solve a problem. For example, how can the school do to ensure that new employees get all the support they need? Hypotheses A problem formulation can be in the form of a hypotheses. E.g the school is hiring the wrong kind of people
Considerations in selecting and formulating research problem • Interesting – keeps the researcher interested in it throughout the research process • Researchable (data availability) – can be investigated through the collection and analysis of data • Significant (relevance) – contributes to the improvement and understanding of educational theory and practice • Manageable (Expertise) – fits the level of researcher’s level of research skills, needed resources, and time restrictions • Ethical – does not embarrass or harm participants
Development of hypotheses Hypothesis is a formal statement that presents the expected relationship between an independent and dependent variable (Creswell, 1994). They are tentative guesses, intended to be given a direct experimental test when possible. Hypotheses allows to: • Identify the research objectives • Identify the key abstract concepts involved in the research • Identify its relationship to both the problem statement and the literature review Types of hypotheses • Null hypotheses • Positive hypotheses
Null hypotheses states no relationship/difference exists between variables and Statistical test is performed on the null. It is assumed to be true until support for the research hypothesis is demonstrated. For example, there is no significance difference in academic achievement between students from different socio-economic background at SUA. • Alternative hypothesis is a statement that suggests a potential outcome that the researcher may expect. For example, there is significance difference in academic achievement between students from different socio-economic background at SUA.
Directional hypothesis specifies the direction of the relationship between independent and dependent variables • Non-directional hypothesis shows the existence of a relationship between variables but no direction is specified Characteristics of research hypotheses • Testable and measurable; hypotheses can be tested –verifiable or falsifiable • Hypotheses are not moral or ethical questions • Prediction: hypothesispredicts the anticipated outcome of the experiment • Hypothesesgives insight into a research question • Describe clearly, and provide identification of the most important variables in operational terms.
Hypotheses specify expected relationships among independent, dependent, and control variables. • Hypotheses are value free in the sense that they exclude the personal biases of the researcher. 3.4. Sampling and sampling techniques Definitions and conceptualizations • Sampling is the process of selecting participants from the population. • The target populationis the total group of individuals from which the sample might be drawn and generalizations are made. • Sampling frame is a list of subjects from which a sample of subjects is selected • Population is the entire set of individuals or other entities to which study findings are to be generalized.
Sample is a subset of a population that is used to study the population as a whole. • Elements is the individual members of the population whose characteristics are to be measured. In quantitative research, a sample is normally picked using accepted statistical methods based on the laws of probability. Some of the common methods used in probability or quantitative sampling are; • Simple random sampling • Cluster sampling • Systematic sampling • Stratified sampling • Multi-stage sampling
The primary goal of sampling (why sample) • researcher can study the smaller group and produce accurate generalizations about the larger group. • Quantitative researchers tend to use a type of sampling based on theories of probability from mathematics, called probability sampling. • In reality there is simply not enough; time, energy, money, labour/man power, equipment, access to suitable sites to measure every single item or site within the parent population or whole sampling frame. • Therefore an appropriate sampling strategy is adopted to obtain a representative, and statistically valid sample of the whole.
Types of sampling Probability Sampling issampling technique in which each unit in a population has a specifiable chance of being selected. Non-probability sampling is based on human choice rather than random selection. Population unit has no specifiable chance of being selected. Simple Random Sampling • A simple random sampling is a sample of a given size in which all such subsets of the frame are given an equal probability to be chosen. Each member of the population has an equal and known chance of being selected.
Advantages of Simple random sampling • One of the great advantages of simple random sampling method is that it needs only a minimum knowledge of the study group of population in advance. • It is free from errors in classification. • This is suitable for data analysis which includes the use of inferential statistics. • Simple random sampling is representative of the population • It is totally free from bias and prejudice • The method is simple to use. • It is very easy to assess the sampling error in this method.
Disadvantages of Simple random sampling • This method carries larger errors from the same sample size than that are found in stratified sampling. • In simple random sampling, the selection of sample becomes impossible if the units or items are widely dispersed. • One of the major disadvantages of simple random sampling method is that it cannot be employed where the units of the population are heterogeneous in nature. • This method lacks the use of available knowledge concerning the population. Sometimes, it is difficult to have a completely cataloged universe.
In a simple random sample of a given size, all such subsets of the frame are given an equal probability (minimizes bias). Each element has an equal probability of selection. • However, SRS can be vulnerable to sampling error because the randomness of the selection may result in a sample that doesn't reflect the makeup of the population Multi-stagesampling • Multi-stagesampling is a more complicated form of cluster sampling in which larger clusters are further subdivided into smaller, more targeted groupings for the purposes of study. • This is sampling within previously sampled clusters. Next, the investigator identifies which elements to sample from within the clusters
Advantages of multi-stage sampling • Multi-stage sampling can be easier to implement and can create a more representative sample of the population than a single sampling technique. • Multi-stage sampling gives researchers with limited funds and time a method to sample from such larger populations(simplification and cost consideration) • The multi-stage form of sampling is flexible in many senses. it allows researchers to employ random sampling or cluster sampling after the determination of groups. there are no restrictions on how researchers divide the population into groups.
Due to the fact that multi-stage sampling cuts out portions of the population from the study, the study's findings can never be 100% representative of the population (possibility of lost data). • The method however, may be considered overly-expensive or time consuming for the investigator. Stratified Sampling • Stratified Sampling is a method which makes sense to partition the population into groups based on a factor that may influence the variable that is being measured. These groups are called strata. An individual group is called a stratum.
Advantages of stratified sampling • Withfairly homogeneous groups, stratification generally produces more precise estimates of the population percents than estimates that would be found from a simple random sample. • It ensures a high degree of representativeness of all the strata or layers in the population. Therefore we can generalize from the results obtained (even minority can be represented proportionally). • The results are more accurate because sampling error is reduced because of the grouping of similar units. • Stratification permits separate analyses on each group and allows different interests to be analyzed for different groups. .
Disadvantages of stratified sampling • Gathering such a sample would be extremely time consuming and difficult to do (tedious) . • Also, it may be difficult in some populations to divide into strata especially when some characteristics (criteria) are unknown to researcher.
Systematic Sampling • Systematic Sampling chooses subjects in a systematic (i.e. orderly / logical) way from the target population, like every nth participant on a list of names. • By dividing the number of people in the population by the number of people you want in your sample, you get a number we will call nth- case. • in systematic sampling ,a random start, and then selecting elements at regular intervals through that ordered list. • The advantage of systematic sampling • it ensures a high degree of representativeness, and no need to use a table of random numbers
Systematic random sampling is often easier to use than simple random sampling, especially for large samples, as only one random number (the random start) is required, Disadvantages of systematic sampling • The method is less random than simple random sampling
Cluster Sampling Cluster Sampling is when population is divided into (geographical) clusters where some clusters are chosen at random - within cluster units are randomly chosen or sampled. Thus, each cluster should be heterogeneous. • Thus, the statistical analysis used with cluster sampling is not only different, but also more complicated than that used with stratified sampling. • Advantages; firstly, it is more cost-effective to select respondents in groups ("clusters"). Clustering can reduce travel and administrative costs. Secondly, it also means that one does not need a sampling frame listing all elements in the target population. Thirdly, sometimes it is too expensive to make a complete list of all the elements of the population that we want to study. Fourthly, this sampling method has the advantage that it simplifies the collecting of the sample information.
Finally, cluster sampling addresses two problems especially when researchers lack a good sampling frame for a geographically dispersed population and when the cost to reach a sampled element is very high. • The main disadvantage is that if the clusters are not homogeneous among them, the final sample may not be representative of the population. Thus, cluster sampling may generally increase the variability of sample estimates
3.5. Instrumentation and data collection • Research instrument is the device that researchers use for a measurement purpose (survey, test, questionnaire, etc.). • Instrumentation is the course of action or the process of developing, testing, and using the device. • The instrumentation plan is composed of a number of decisions to include; • What data are needed to answer the research questions, • How to gather the data, • When to gather the data, • Where to gather the data, and • How to analyze the data.
Data collection refers to assembling data required to answer the research question from respondents, using instruments. • Data it is a collection of information, in the form of numerical measures of respondents’ attributes (in quantitative research) or , texts, voices, or images (in qualitative research). Methods of data collection in quantitative research • Questionnaires • Structured Interview • Structured Observations • Using scales • Testing