Download

1 / 30
300 likes | 419 Views
This presentation explores how geography and Geographic Information Systems (GIS) are essential in identifying and analyzing public health disparities. The discussion highlights four main points: the discipline of geography, the unique tools GIS offers for answering complex questions, the statistical techniques geographers employ, and the communicative power of cartography. Topics such as disease diffusion, health care delivery systems, and predictive modeling are also addressed, exemplified by historical cases like John Snow's cholera map and modern resources for real-time health tracking.

E N D
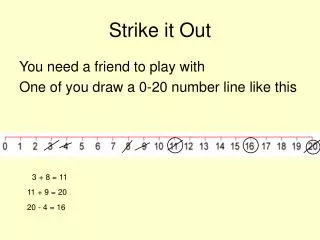
Mapping It Out using geography to identify and analyze public health disparities Steve Graves
Four Main Points • Geography is a discipline, not a subject. • GIS is a tool that offers you the means to answer questions that you otherwise could not answer. • Geographers have useful statistical techniques. • Cartography is a language that communicates your findings effectively.
Geography • Geography is a discipline • Our subject is anything that can be mapped. • Somewhat unique epistemology • We ask “where?” when we want to answer “why?” • Somewhat unique methodological tool box • Spatial stats, spatial analysis • Geographic information systems, unique analysis • Complex, multivariate analysis is common • Tests for spatial autocorrelation - overlooked • Powerful communicative media – the map.
Health and Medical GeographyTopics in Geography 486 • Human Ecology of Disease • Landscape Epidemiology • Development and Human Health • Biometeorology • Pollution • Disease Diffusion • Health Care Delivery Systems • Health Care Resource Distribution • Health Service Planning
John Snow’s Cholera Map • Medical Geography has a long history. • http://en.wikipedia.org/wiki/John_Snow_(physician)
Mapped outbreak and traced disease to a water pump. Bolstered germ theory John Snow’s Cholera Map X
Maps of outbreaks can show the spread of infection through time and space. Animated File of Cholera Outbreak
Realtime Outbreak Map • Modern example, relatively easy to make. • http://healthmap.org/en
H1N1 Real Time Mapping • Relatively simple to create maps can help those responsible for health care delivery to respond to crises. • http://flutracker.rhizalabs.com/ • See next slide
Some other uses • Maps can show disparity in health care delivery • Help patients find quality health care • Help authorities assess risk • See the following slides…
HIV mapping in San Francisco • Rather than simply mapping cases, this map demonstrates variation in viral load of patients. • It indicates disparity in treatment, since average viral load is a measure of “how sick” the patients are.
Online Hospital Ranking Maphttp://www.netdoc.com/hospital-rankings/
GIS capabilities • A GIS can layer many types of spatial data • Points, polygons, lines • The GIS has analysis functions that allow researchers to analyze data at different spatial scales and obtained in different formats • Many statistical transformations, some of which are unique to spatial data…like spatial autocorrelation. • Some simple techniques, like layering, helps researchers and students make predictive models of disease or health threats.
African Eye worm. The environmental conditions associated with diagnosed cases of Loa Loa are used to identify locations with similar environmental conditions for the disease exist. Predictive Modeling of Loa loa
Lead Poisoning Risk Map - Philadelphia • This analysis allows health officials to efficiently allocate resources for mitigation, prevention and education.
Map Layering Example • The location where malarial mosquitoes can be predicted by collecting and layering maps showing known causal variables. • Low lying, stagnant water bodies • Vegetation types and shade cover • Soil types • Elevation • Population density, etc.
Maps show (in blue) locations where risk is greatest. Could be used to disburse much needed medicine or mosquito nets. Mosquito Habitat Map
Maps: Great Communicators! • Graphic representations of data frequently more powerful than numeric or textual representations. • Maps seem authoritative to policy makers and stake holders. • See following images..
Note how this map represents election results much differently? Is America polarized or are we centrists? Red State Blue State Cartogram
And finally… • Maps can also be entertaining, especially when they are interactive (not in this presentation), even while they are informative. • The following map shows access to McDonald’s restaurants nationwide. • Fast food nation indeed…