Download

1 / 32
320 likes | 476 Views
HYPOTHESIS TESTING FAKHRULROZI HUSSAIN http://fakhrulrozi.com/. Interesting Hypotheses. Bankers assumed high-income earners are more profitable than low-income earners

E N D
HYPOTHESIS TESTING FAKHRULROZI HUSSAIN http://fakhrulrozi.com/
Interesting Hypotheses • Bankers assumed high-income earners are more profitable than low-income earners • Clients who carefully balance their checkbooks every month and minimize fees due to overdrafts are unprofitable checking account customers
Null and Alternative Hypotheses H0 -> Null Hypotheses Ha -> Alternative Hypotheses
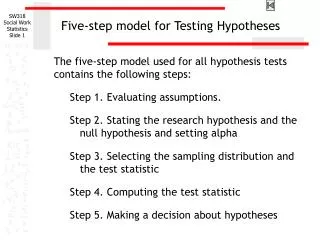
Steps in Conducting a Hypothesis Test • Step 1. Set up H0 and Ha • Step 2. Identify the nature of the sampling distribution curve and specify the appropriate test statistic • Step 3. Determine whether the hypothesis test is one-tailed or two-tailed
Steps in Conducting a Hypothesis Test • Step 4. Taking into account the specified significance level, determine the critical value (two critical values for a two-tailed test) for the test statistic from the appropriate statistical table • Step 5. State the decision rule for rejecting H0 • Step 6. Compute the value for the test statistic from the sample data • Step 7. Using the decision rule specified in step 5, either reject H0 or reject Ha
Example 1 : Launching a Product Line Into a New Market Area Karen, product manager for a line of apparel, to introduce the product line into a new market area. Survey of a random sample of 400 households in that market showed a mean income per household of $30,000.Karen strongly believes the product line will be adequately profitable only in markets where the mean household income is greater than $29,000. Should Karen introduce the product line into the new market?
Karen’s Hypothesis • Karen’s decision making is equivalent to either accepting or rejecting the hypothesis: • The population mean household income in the new market area is greater than $29,000
One-Tailed Hypothesis Test H0: $29,000 Ha: $29,000
Sample mean (x) values greater than $29,000--that is x-values on the right-hand side of the sampling distribution centered on µ = $29,000--suggest that H0 may be false. More important the farther to the right x is , the stronger is the evidence against H0 Identifying the Critical Sample Mean Value – Sampling Distribution
Karen’s Decision Rule for Rejecting the Null Hypothesis • Reject H0 if the sample mean exceeds xc
Every mean x has a corresponding equivalent standard Normal Deviate: • The expression for z • x- • Z = --------- • sx • x = + zsx • Substituting xc for x and zc for z • xc = + zcsx where zc is standard normal deviate • corresponding to the critical sample mean, xc. Criterion Value
Standard deviation for the sample of 400 households is $8,000. The standard error of the mean (sx) is given by • S • s = ---- = $400 • n • Critical mean household income xc through the following two steps: • 1. Determine the critical z-value,zc.For =.05, From table, zc = 1.645. • 2. Substitute the values of zc, s, and (under the assumption that H0 is"just" true ), xc = + zc s = $29,658. x Computing the Criterion Value
Karen’s Decision Rule • If the sample mean household income is greater than $29,658, reject the null hypothesis and introduce the product line into the new market area.
The value of the test statistic is simply the z-value corresponding to = $30,000. x- Z = ------ = 2.5 s Test Statistic
P - Value – Actual Significance Level • The probability of obtaining an x-value as high as $30,000 or more when is only $29,000 = .0062 • This value is sometimes called the actual significance level, or the p-value • The actual significance level of .0062 in this case means the odds are less than 62 out of 10,000 that the sample mean income of $30,000 would have occurred entirely due to chance (when the population mean income is $29,000 or less)
Conduct T-Test when sample is small Let the sample size, n = 25 X = $30,000 , s = $8,000 From the t-table in , tc = 1.71 for = .05 and d.f. = 24. Decision rule: “Reject H0 if t 1.7l.” T-test
The value of t from the sample data: S = 8000/25 = $1,600 x- t = ------ = 0.625 sx The computed value of t is less than 1.71, H0 cannot be rejected. Karen should not introduce the product line into the new market area. T-test
Two-Tailed Hypothesis Test • Two-tailed test is one in whichvalues of the test statistic leading to rejectioin of the null hypothesis fall in both tails of the sampling distribution curve H0 : = $29,000 Ha : $29,000
Test of Two Means • A health service agency has designed a public service campaign to promote physical fitness and the importance of regular exercise. Since the campaign is a major one, the agency wants to make sure of its potential effectiveness before running it on a national scale • To conduct a controlled test of the campaign’s effectiveness, the agency needs two similar cities • The agency identified two similar cities • city 1 will serve as the test city • city 2 will serve as a control city
Test of Two Means • Random survey of was conducted to measure the average time per day a typical adult in each city spent on some form of exercise • 300 adults in city 1, • 200 adults in city 2 • Results of the survey : • average was 30 minutes per day (with a standard deviation of 22 minutes) in city 1 • Average was 35 minutes per day (with a standard deviation of 25 minutes) in city 2 • Question • From these results, can the agency conclude confidently that the two cities are well matched for the controlled test?
City 1: n1= 300 x1 = 30 s1 = 22 City 2: n2= 200 x2 = 35 s2 = 25 The hypotheses are H0: 1 =2 or1 -2 = 0 Ha: 12or1 -2 0 Basic Statistics and Hypotheses
Test statistic is the z-statistic, given by (x1 - x 2) - (1 - 2 ) z = ------------------------------- s12/n1 + s22/n2 n1and n2are greater than 30. The z-statistic can therefore be used as the test statistic. Test Statistic
Decision – Two-Tailed Test • For Two-Tailed tests • Identify two critical values of z, one for each tail of the sampling distribution • The probability corresponding to each tail is .025, since = .05 • From the Normal Table, the z-value, for /2 =.025 is 1.96 • Decision rule : “Reject H0 if z -1.96 or if z 1.96.”
Computing the value of z from the survey results and under the customary assumption that the null hypothesis is true (i.e., 1 - 2 = 0): (30 - 35) - (0) z = --------------------------------- = -2.29 (22)2/300 + (25)2/200 Since z -1.96, we should reject H0. Computing Z-value – Two-Tailed Test
Test statistic (x1 - x2) - (1 - 2 ) t = ------------------------- s* ( 1/n1 + 1/n2 ) with d.f. = n1 + n2 - 2. In this expression, s* is the pooled standard deviation, given by (n1 – 1)s12 + (n2 – 1)s22 s* = --------------------------------- n1 + n2 - 2 T- Test for Independent Samples
n1= 20 x1 = 30 s1 = 22 n2= 10 x2 = 35 s2 = 25 The degrees of freedom for the t‑statistic are d.f. = 28 Critical value of t with 28 d.f for a tail probability of .025 is 2.05. Decision rule : “Reject H0 if t -2.05 or if t 2.05." The pooled standard deviation is s* = 529 (approximately) = 23 T- Test for Independent Samples - Two Cities
T- Test for Independent Samples The test statistic is t= -.56 Since t is neither less than -2.05 nor greater than 2.05, we cannot reject H0 The sample evidence is not strong enough to conclude that the two cities differ in terms of levels of exercising activity of their residents.