GDP Deflator
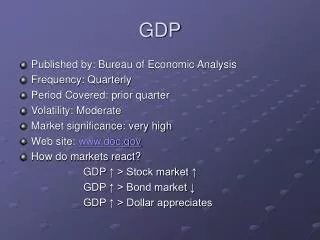
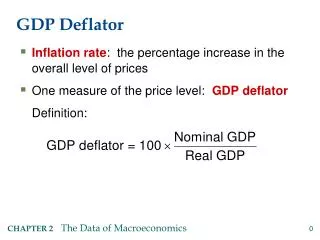
GDP Deflator. Inflation rate : the percentage increase in the overall level of prices One measure of the price level: GDP deflator Definition:. NOW YOU TRY: GDP deflator and inflation rate. Use your previous answers to compute the GDP deflator in each year.


GDP Deflator
E N D
Presentation Transcript
GDP Deflator • Inflation rate: the percentage increase in the overall level of prices • One measure of the price level: GDP deflator Definition:
NOW YOU TRY:GDP deflator and inflation rate • Use your previous answers to compute the GDP deflator in each year. • Use GDP deflator to compute the inflation rate from 2006 to 2007, and from 2007 to 2008.
Two arithmetic tricks for working with percentage changes EX: If your hourly wage rises 5% and you work 7% more hours, then your wage income rises approximately 12%. 1. For any variables X and Y, percentage change in (XY) percentage change in X+ percentage change in Y
Two arithmetic tricks for working with percentage changes EX: GDP deflator = 100 NGDP/RGDP. If NGDP rises 9% and RGDP rises 4%, then the inflation rate is approximately 5%. 2. percentage change in (X/Y) percentage change in Xpercentage change in Y
Chain-Weighted Real GDP • Over time, relative prices change, so the base year should be updated periodically. • In essence, chain-weighted real GDPupdates the base year every year, so it is more accurate than constant-price GDP. • Your textbook usually uses constant-price real GDP, because: • the two measures are highly correlated. • constant-price real GDP is easier to compute.
Consumer Price Index (CPI) • A measure of the overall level of prices • Published by the Bureau of Labor Statistics (BLS) • Uses: • tracks changes in the typical household’s cost of living • adjusts many contracts for inflation (“COLAs”) • allows comparisons of dollar amounts over time
How the BLS constructs the CPI 1. Survey consumers to determine composition of the typical consumer’s “basket” of goods 2. Every month, collect data on prices of all items in the basket; compute cost of basket 3. CPI in any month equals
NOW YOU TRY:Compute the CPI For each year, compute • the cost of the basket • the CPI (use 2002 as the base year) • the inflation rate from the preceding year Basket: 20 pizzas, 10 compact discs prices: pizza CDs 2002 $10 $15 2003 $11 $15 2004 $12 $16 2005 $13 $15
Understanding the CPI Example with 3 goods For good i = 1, 2, 3 Ci = the amount of good i in the CPI’s basket Pit = the price of good iin month t Et = the cost of the CPI basket in month t Eb = the cost of the basket in the base period
Understanding the CPI The CPI is a weighted average of prices. The weight on each price reflects that good’s relative importance in the CPI’s basket. Note that the weights remain fixed over time.
Why the CPI may overstate inflation • Substitution bias: The CPI uses fixed weights, so it cannot reflect consumers’ ability to substitute toward goods whose relative prices have fallen. • Introduction of new goods: The introduction of new goods makes consumers better off and, in effect, increases the real value of the dollar. But it does not reduce the CPI, because the CPI uses fixed weights. • Unmeasured changes in quality: Quality improvements increase the value of the dollar, but are often not fully measured.
The size of the CPI’s bias • In 1995, a Senate-appointed panel of experts estimated that the CPI overstates inflation by about 1.1% per year. • So the BLS made adjustments to reduce the bias. • Now, the CPI’s bias is probably under 1% per year.
NOW YOU TRY:Questions for Discussion 1. If your grandmother receives Social Security, how is she affected by the CPI’s bias? 2. Where does the government get the money to pay COLAs to Social Security recipients? 3. If you pay income and Social Security taxes, how does the CPI’s bias affect you? 4. Is the government giving your grandmother too much of a COLA? 5. How does your grandmother’s basket differ from the CPI’s? Does this affect your answer to Q4?
CPI vs. GDP Deflator Prices of capital goods: • included in GDP deflator (if produced domestically) • excluded from CPI Prices of imported consumer goods: • included in CPI • excluded from GDP deflator The basket of goods: • CPI: fixed • GDP deflator: changes every year
Two measures of inflation in the U.S. CPI Percentage change from 12 months earlier GDP deflator
Categories of the population • employed working at a paid job • unemployed > 16yrs, not employed but looking for a job and has made specific efforts to find work during the previous 4 wks. • labor force the amount of labor available for producing goods and services; all employed plus unemployed persons • not in the labor forcenot employed, not looking for work
Two important labor force concepts • unemployment rate percentage of the labor force that is unemployed • labor force participation rate the fraction of the adult population that “participates” in the labor force
NOW YOU TRY:Computing labor statistics Use the above data to calculate • the labor force • the number of people not in the labor force • the labor force participation rate • the unemployment rate U.S. adult population by group, May 2009 Number employed = 140.57 million Number unemployed = 14.51 million Adult population = 235.45 million
NOW YOU TRY:Percentage changes in labor statistics Suppose • population increases by 1% • labor force increases by 3% • number of unemployed persons increases by 2% Compute the percentage changes in the labor force participation and unemployment rates.
The establishment survey • The BLS obtains a second measure of employment by surveying businesses, asking how many workers are on their payrolls. • Neither measure is perfect, and they occasionally diverge due to: • treatment of self-employed persons • new firms not counted in establishment survey • technical issues involving population inferences from sample data
Two measures of employment growth Percentage change from 12 months earlier
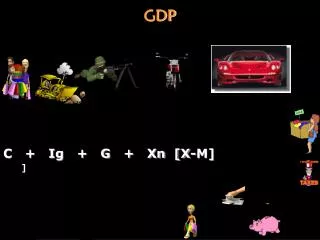
CHAPTER SUMMARY • Gross Domestic Product (GDP) measures both total income and total expenditure on the economy’s output of goods & services. • Nominal GDP values output at current prices; real GDP values output at constant prices. Changes in output affect both measures, but changes in prices only affect nominal GDP. • GDP is the sum of consumption, investment, government purchases, and net exports.
CHAPTER SUMMARY • The overall level of prices can be measured by either: • the Consumer Price Index (CPI), the price of a fixed basket of goods purchased by the typical consumer, or • the GDP deflator, the ratio of nominal to real GDP • The unemployment rate is the fraction of the labor force that is not employed.