Download
1 / 29
290 likes | 413 Views
Cost-effectiveness of the World Health Organization treatment guidelines in Africa. Eran Bendavid Philip Grant, Annie Talbot, Douglas Owens, Andrew Zolopa Stanford University. Motivation (1) – new guidelines. When to start: CD4 count of 350 cells/mm 3

E N D
Cost-effectiveness of the World Health Organization treatment guidelines in Africa EranBendavidPhilip Grant, Annie Talbot, Douglas Owens, Andrew Zolopa Stanford University
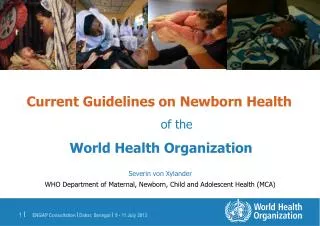
Motivation (1) – new guidelines • When to start: CD4 count of 350 cells/mm3 • What to start: one of four regimens containing AZT, TDF, NVP, or EFV • What not to start: regimens containing d4T
Next few slides • Framing the question • Approach • Model structure • Assumptions • Results • Comparative effectiveness • Cost-effectiveness • Implications
Evaluating the WHO guidelines What is the comparative effectiveness and cost-effectiveness of the 1st line regimens recommended in the new guidelines, as well as the regimen in most common use? • Tenofovir + lamivudine + efavirenz (TDF/3TC/EFV) • Tenofovir + lamivudine + nevirapine (TDF/3TC/NVP) • Zidovudine + lamivudine + efavirenz (AZT/3TC/EFV) • Zidovudine+ lamivudine+ nevirapine (AZT/3TC/NVP) • Stavudine + lamivudine + nevirapine (d4T/3TC/NVP)
Model structure • Simulation of HIV disease and treatment calibrated to South African data • Simulated individual patient histories • Calculate population average life expectancies, quality-adjusted life expectancies, and costs • A few illustrative patient histories look like this… Badri (Lancet 2006), Lawn (AIDS 2009), Holmes (JAIDS 2006)
Simulation example Start ART Failure Tuberculosis CD4 log VL
Simulation example Start ART Failure Toxicity 2nd line PCP CMV CD4 log VL
Simulation example TB + blip Start ART CD4 log VL
Simulation example Start ART CD4 log VL
Assumption 1 – virologic failure ( Regimen Failure ( Yr 1) Failure Yr 3) TDF/3TC/EFV 12% (8 - 16%) 24% (16 - 32%) TDF/3TC/NVP 18% (12 - 24%) 31% (22 - 40%) AZT/3TC/EFV 17% (10 - 24%) 31% (20 - 42%) AZT/3TC/NVP 25% (16 - 34%) 46% (32 - 60%) d4T/3TC/NVP 18% (12 - 24%) 31% (22 - 40%) Gallant (NEJM 2006, JAMA 2004), Smith (JID 2005 ), Arribas (JAIDS 2008), Nachega (AIDS 2008)
Assumption 2 – toxicities Haubrich (AIDS 2009), Arribas (JAIDS 2008), Gallant (JAMA 2004, NEJM 2006), Amoroso (CROI 2007)
Assumption 3 - costs Annual regimen costs are substantially different • TDF/3TC/EFV : $675 • TDF/3TC/NVP : $538 • AZT/3TC/EFV : $384 • AZT/3TC/NVP : $247 • d4T/3TC/NVP : $121 WHO, Global Price Reporting Mechanism
Results – comparative effectiveness Regimen Quality - L ife Mean number adjusted life years of opportunistic years (disc.) (discounted) diseases TDF/3TC/EFV 11.27 12.82 2.03 TDF/3TC/NVP 11.08 12.54 2.18 AZT/3TC/EFV 10.69 12.72 2.07 AZT/3TC/NVP 10.47 12.39 2.22 d4T/3TC/NVP 10.31 12.51 2.17
Results – cost-effectiveness 11.4 11.2 11.0 Discounted QALYs 10.8 10.6 AZT/3TC/NVP 10.4 d4T/3TC/NVP 10.2 7,500 8,000 8,500 9,000 9,500 10,000 Lifetime costs (Discounted 2009 USD)
Results – cost-effectiveness 11.4 11.2 11.0 TDF/3TC/NVP Discounted QALYs $1,045/QALY gained 10.8 10.6 AZT/3TC/NVP 10.4 d4T/3TC/NVP 10.2 7,500 8,000 8,500 9,000 9,500 10,000 Lifetime costs (Discounted 2009 USD)
Results – cost-effectiveness 11.4 11.2 11.0 TDF/3TC/NVP Discounted QALYs $1,045/QALY gained 10.8 AZT/3TC/EFV 10.6 AZT/3TC/NVP 10.4 d4T/3TC/NVP 10.2 7,500 8,000 8,500 9,000 9,500 10,000 Lifetime costs (Discounted 2009 USD)
Results – cost-effectiveness 11.4 $5,950/QALY gained TDF/3TC/EFV 11.2 11.0 TDF/3TC/NVP Discounted QALYs $1,045/QALY gained 10.8 AZT/3TC/EFV 10.6 AZT/3TC/NVP 10.4 d4T/3TC/NVP 10.2 7,500 8,000 8,500 9,000 9,500 10,000 Lifetime costs (Discounted 2009 USD)
Implications • d4T-containing regimens are more expensive and less effective than AZT-containing regimens, supporting their elimination from the guidelines • While there are no trials directly comparing AZT/3TC/EFV with TDF/3TC/NVP, the latter appears to be more effective and less costly than the former under a broad set of assumptions • Consideration should be given to recommending TDF/3TC/NVP over AZT/3TC/EFV in usual circumstances • Using World Health Organization thresholds for cost-effectiveness TDF/3TC/NVP may be considered cost-effective in most African settings, but AZT/3TC/NVP is the least costly regimen
In Collaboration WithPhilip Grant – Stanford Infectious DiseasesAnnie Talbot – Stanford Infectious DiseasesDoug Owens – Stanford Health PolicyAndrew Zolopa – Stanford Infectious DiseasesAcknowledgmentNational Institute of Allergy and Infectious Diseases
Assumption 1 – virologic failure Regimen Failure Yr 1 Failure Yr 3 Range TDF/3TC/EFV 12% 24% 8 - 16% , 16 - 32% TDF/3TC/NVP 18% 31% 12 - 24%, 22 - 40% AZT/3TC/EFV 17% 31% 10 - 24%, 21 - 41% AZT/3TC/NVP 25% 46% 16 - 34%, 32 - 60% d4T/3TC/NVP 18% 31% 12 - 24%, 22 - 40%
Assumption 1 – virologic failure Risk of virologic failure varies by ART regimen • Lowest failure: tenofovir + lamivudine + efavirenz • 2nd lowest: zidovudine + lamivudine + efavirenz • 3rd and 4th lowest: tenofovir + lamivudine + nevirapine ; stavudine + lamivudine + nevirapine • Highest failure: zidovudine + lamivudine + nevirapine
Assumption 2 of 3 ARV drugs have associated risk of toxicities • Stavudine (lipoatrophy, neuropathy, lactic acidosis) • Zidovudine (lipoatrophy, anemia) • Tenofovir (lipoatrophy, renal failure) • Nevirapine (hepatotoxicity) Quality of life is decreased with toxicities (least with lipoatrophy, most with lactic acidosis)
11.4 $5,950/QALY gained TDF/3TC/EFV 11.2 11.0 TDF/3TC/NVP Discounted QALYs $1,045/QALY gained 10.8 AZT/3TC/EFV 10.6 AZT/3TC/NVP 10.4 d4T/3TC/NVP 10.2 7,500 8,000 8,500 9,000 9,500 10,000 Lifetime costs (Discounted 2009 USD)
Next few slides • Framing the question (1 slide) • Approach • Model structure (2 slides) • Assumptions (3 slides) • Results and implications • Comparative effectiveness (2 slides) • Cost-effectiveness (2 slides)