Download
1 / 44
450 likes | 473 Views
This presentation discusses the applications of seasonal climate forecasting in water management, focusing on water resources, limitations, and case examples. It covers the hydrological processes, freshwater resources, and water uses in small tropical islands, as well as how seasonal climate forecasts can aid in drought planning and disaster preparedness.

E N D
Selected Applications of Seasonal Climate Forecasting in Water Management Niue 19 – 21 April 2005 Bureau of Meteorology - AusAID project ENHANCED APPLICATIONS OF CLIMATE PREDICTIONS IN PACIFIC ISLAND COUNTRIES (PI-CPP) Ross James, Bureau of Meteorology (Presentation prepared by Tony Falkland)
Outline of Presentation • Scope • Overview of water resources and uses • Applications of seasonal climate forecasts • Limitations in using seasonal climate forecasts • Case examples
Scope • Water management • Focus on water supply systems • Forecasts • Considering seasonal climate forecasts • Not considering forecasts of weather /climate at other time scales such as: • Flood forecasting (short time scale) • Cyclone warnings (short time scale) • Longer-term climate variability (e.g. for design of larger water supply systems)
Summary water & other data for selected PICs Basic data
Summary water & other data for selected PICs Water related data
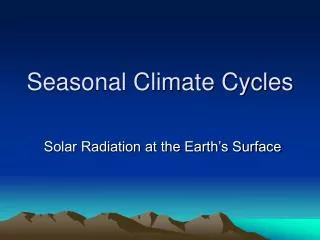
Major hydrological processes are: • Precipitation (mainly rain; also hail, dew, frost, snow) • Surface retention (interception and depression storage) • Infiltration • Soil-water redistribution • Evaporation & transpiration (Evapotranspiration) • Surface runoff • Groundwater recharge • Groundwater movement & discharge (includes mixing withsaltwater) Hydrological cycle and processes
Freshwater Resources of Small Tropical Islands Common, naturally occurring SURFACE WATER GROUNDWATER RAINWATER Less common or more expensive DESALINATION IMPORTATION USE of SEAWATER or BRACKISH WATER WASTEWATER REUSE
Main Types of Water Resources High Island: Surface & Groundwater Resources Low Island: Groundwater Resources only
Surface Water Resources • RIVERS & STREAMS • surface • subterranean (in karstic formations) • SPRINGS • on island • at coastline • submarine • LAKES & SWAMPS • fresh • brackish
Groundwater Resources(HIGH ISLAND example) Example from the Hawaiian Islands - perched (horizontal) showing 3 types of groundwater aquifers - perched (vertical) - basal
Groundwater Resources(LOW ISLAND example) Example of small coral island basal aquifer only from a typical atoll with thick (often called a ‘freshwater lens’) transition zone
Water uses • Water supply (most important use) • Tourism (selected islands) • Irrigated agriculture (limited) • Hydropower (limited to some islands) • Mining (limited to some islands)
How can Seasonal Climate Forecasts (SCFs) help in water management? • SCFs can give probabilitiesof above average, average and below average rainfall and temperature • Rainfall forecasts are particularly important. Rainfall is the main ‘input’ in the hydrological cycle. Impacts on : • Soil moisture • Streamflow • Groundwater recharge • Spring outflows • Temperature forecasts are less important. Temperature is not the only factor influencing evapotranspiration (one of the main ‘outputs’ in the hydrological cycle)
Applications of seasonal climate forecasts to water management (a) Forecasts of lower than normal rainfall • Activate drought planning measures (b) Forecasts of higher than normal rainfall (and possible frequency of tropical cyclones) • Enhance disaster planning and preparedness
Applications : (a) Drought planning • Increase monitoring and surveillance of water resources • Streamflows, water levels (reservoirs and groundwater) • Groundwater salinity in coastal and small island aquifers • Plan for emergency water supply measures. Examples are: • Barging of water (Fiji, Tonga) • Desalination (Marshall Islands, Tuvalu) • Temporary dug wells on beach below high tide in some islands • Coconuts - substitute for freshwater (temporary use) • Brackish or seawater - non-potable purposes • Prepare to change water supply procedures, e.g.: • Use (more expensive) pumping rather than surface water sources • Use more distant sources rather then closer, less expensive sources • Accept higher groundwater salinity conditions during the drought
Applications : (a) Drought planning (cont’d) • Increase water conservation measures (especially urban areas) • Advise communities of possible need for water restrictions • Advise householders to conserve rainwater for essential needs • Commence use of water from special communal storages (e.g. Funafuti, Tuvalu). • Increase leakage control measures • Plan for alternative electricity sources where hydropower is used • Advise communities in advance • Possible need for additional funds to run diesel powered stations
Applications: (b) Disaster planning & preparedness • Increase surveillance of weather conditions • Ensure measures in place for possible increased flooding • Assess vulnerability of critical areas (e.g. urban areas, water supply infrastructure) • Check/update existing plans & operational procedures • Undertake road and bridge maintenance • Check/clear floodways upstream of critical areas • Ensure capability to disseminate warnings in a timely manner • Plan for gauging of streams in high flow conditions • Need to check equipment, transport & access • Need for appropriately trained personnel • Ensure sufficient funds are available for contingencies
Limitations of seasonal climate forecasts • Not applicable to short-term forecasting: • Flood forecasting (except higher rainfall forecasts may indicate greater risk of floods) • Cyclone warnings (except that frequency of cyclones may vary) • Not applicable to water supply schemes that account for longer-term climate variability: • Many large water supply/resource systems are designed using sustainable yield principles (which take account of seasonal fluctuations in climate)
Case examples • Groundwater pumping strategies to cope with droughts • Home Island, Cocos (Keeling) Islands • Assessment of streamflow conditions • Australia • Hawaiian Islands • Use of Drought Indices (using rainfall data where there is insufficient water resources data) • Rarotonga, Cook Islands • South Tarawa, Kiribati
Groundwater pumping strategies (to cope with droughts) Two main approaches: • Fixed pumping rates • Based on estimation of sustainable yield • Used where consequences of ‘failure’ are high • Seasonal forecasting is not applicable as pump rates do not vary • Examples include groundwater pumping systems for: • South Tarawa, Kiribati • Nuku’alofa, Kingdom of Tonga • Variable pumping rates • Based on rainfall index and/or groundwater salinity • Has application for seasonal forecasting • Example: • Water supply to Home Island, Cocos (Keeling) Islands
Groundwater pumping strategy for Home Island, Cocos (Keeling) Islands • Coral atoll in Indian Ocean (territory of Australia) • Groundwater supplied to 500 people on Home Is • Example of variable pumping rates
Groundwater pumping strategy for Home Island • Fresh groundwater occurs in the form of a freshwater lens (above saline water)
Groundwater pumping strategy for Home Island Infiltration galleries(‘skimming wells’) are used to pump groundwater Typical infiltration gallery details
Groundwater pumping strategy for Home Island Sustainable yield (safe pumping rate) of the freshwater lens: • 150 kilolitres per day (kL/day) • estimated using groundwater model using • data frommulti-level monitoring boreholes • recharge estimates based on daily rainfall readings and evaporation estimates Layout of Galleries and Boreholes (Main Lens)
Groundwater pumping strategy for Home Island Regular monitoring of groundwater salinity and rainfall: • Daily: Rainfall and volumes of water pumped from each gallery • Monthly: Groundwater salinity data from 9 galleries every month (7 in main lens and 2 in northern lens) • Quarterly: Groundwater salinity v depth data from 18 boreholes Daily-read raingauge Borehole monitoring
Groundwater pumping strategy for Home Island Daily rainfall data : • Home Island: 1987 – present (18 years) • West Island (Bureau of Meteorology stn): 1952 – present (53 years)
Groundwater pumping strategy for Home Island Monthly groundwater salinity data at galleries: • 1992 – present (13 years)
Groundwater pumping strategy for Home Island Quarterly groundwater salinity data from boreholes • Late 1987 – 2004 (17 years) Fresh groundwater indicated to base of red line (EC = 2,500 μS/cm) Borehole, HI1 (centre of main lens): salinity monitoring data
Groundwater pumping strategy for Home Island Rainfall index and groundwater salinity updated each month: • Rainfall index based on previous 12 months rainfall & ‘decay factor’ of 0.9 • Groundwater salinity from blended water (from all galleries) and a ‘critical’ (No 1) gallery
Groundwater pumping strategy for Home Island Pumping strategy: • Pump at sustainable rate when ‘dry’ conditions apply • Allow pumping at higher rates during other times The table below shows pumping rates for different conditions of a rainfall index & groundwater salinity at main tank Procedure each month: • Rainfall index is updated & groundwater salinity is checked • Pumping rates at galleries are set according to the ‘climate condition’ (based on worst of rainfall index and groundwater salinity criteria) • At present, the strategy is based on historical data and not on forecasts
Groundwater pumping strategy for Home Island Seasonal climate forecasts could be used to forecast pumping conditions: To do this, options are: • Update rainfall index with rainfall estimate based on rainfall forecast • Update groundwater salinity based on forecast rainfall using relationship between rainfall index and groundwater salinity Example of relationship between rainfall index and groundwater salinity • Possibly develop direct relationship between predictors (e.g. SSTs or SOI) and groundwater salinity
Applications to other islands • The same or similar type of approach could be used in other islands: • Which use groundwater pumping systems • Where monitoring data is available for daily rainfall, daily pumping volumes and groundwater • On Home Island, groundwater salinity is the key parameter. In other islands, groundwater level and/or salinity could be used
Assessment of Streamflow Conditions (a) Australia • Chiew and McMahon (2003) • Study of teleconnections between ENSO indicators and monthly rainfall / streamflow • Examined data from 284 catchments for period 1901-1998 • Investigated potential for forecasting rainfall and streamflow several months ahead using: • Lag correlations between ENSO indicators (the SOI and a Multivariate ENSO Index, MEI) and rainfall / streamflow. The lag was one season. • Serial correlations in rainfall and in streamflow (statistical properties of each variable)
Assessment of Streamflow Conditions (a) Australia (continued) • Main Findings: • Forecasting of streamflows in parts of Australia is feasible for selected times of the year. • Using ENSO indicators: • Moderate to high correlation with spring & summer (Sept – Feb) streamflow • Reasonable correlation with autumn (April-June) streamflow • The serial correlation in streamflow can also be used for forecasting: • Similar results to lag correlations for streamflow with ENSO indicators. • Strongest for spring, summer and winter, particularly in southern Australia. • Comment: • Further work is being done on this topic • Potential to apply these proceduresin Pacific Island countries (provided there is sufficient streamflow data)
Assessment of Streamflow Conditions (b) Hawaiian Islands • Oki (2004) • Analysis of long-term flows trends in 5 islands (Kauai, Oahu, Molokai, Maui and Hawaii) • Data from 16 stream-gauging stations. Length of records varied from 36 to 91 years, with average 60 years.
Assessment of Streamflow Conditions (b) Hawaiian Islands (continued) • Main Findings: • Short-term variability in streamflow is mainly related to seasons and ENSO. It may also be partly affected by the phase of the Pacific Decadal Oscillation (PDO). • Streamflow in Jan - March quarter tends to be low following El Niño episodes and high following La Niña episodes. • ENSO is more strongly related to rainfall and direct runoff than groundwater storage and baseflow. • From 1913 to 2002, baseflows generally decreased. Consistent with a long-term downward trend in annual rainfall. • Conclusions: • Further study required into: • The physical causes for the variations in streamflow. • Whether regional climate indicators can successfully be used to predict streamflow trends and variations. • To allow for ongoing study, the network of stream-gauging stations should be maintained.
Use of Drought Indices (a) Rarotonga, Cook Islands • Parakoti and Scott (2002) Rarotonga’s water supply: • 12 stream water intakes around the island • Difficult to meet water demand plus leakage during drought periods Streamflow records: • Relatively short (approx. 4-5 years) at 3 catchments. • Not long enough to correlate with ENSO indicators.
Use of Drought Indices (a) Rarotonga, Cook Islands (continued) • A Drought Index developed to monitor drought onset & severity • Based on monthly rainfall • Several methods investigated • Selected Weighted Sum Drought Index approach using previous 10 months of data and factors decreasing from 0.9 to 0.1 Weighted Sum Drought Index, 1929-2002 (values less than 600 are highlighted)
Use of Drought Indices (a) Rarotonga, Cook Islands (continued) • The Drought Index is currently used as a monitoring and not a predictive tool • At onset of droughts, main drought management strategies are: • Water restrictions • Short-term emphasis on leakage control measures • Additional drought management strategies are: • Introduce water conservation measures (e.g. dual flush cisterns, use of grey water for garden watering) • Design and install roof catchment systems • Require greater public and political awareness of Rarotonga’s water resources • Potential developments: • Update Drought Index each month with SCFs of rainfall (e.g. using estimates of monthly rainfall based on forecast rainfall - high, medium or low) • When sufficient streamflow data is available: correlate streamflow with seasonal climate predictors (SOI and SSTs)
Use of Drought Indices (b) South Tarawa, Kiribati • White et al (1999) • Study of drought and its impact on water supplies • Domestic groundwater wells • Public groundwater system using infiltration galleries on two islands (Bonriki and Buota) • Rainwater tanks • Tarawa and other atolls in Kiribati experience: • Highly variable rainfall – closely related to ENSO cycles • Severe droughts associated with La Niña episodes (e.g. 1998-2000)
Use of Drought Indices (b) South Tarawa, Kiribati (continued) • Drought Index based on Decile Method • rainfalls expressed as percentile rankings of rainfall, accumulated over time periods ranging from 6 months to 5 years • Following categories identified when the accumulated rainfall drops : • Warning of onset of severe dry period : below 40 percentile level • Severe drought : below 10 percentile level Drought Index ranking – 6 months Drought Index ranking – 5 years
Use of Drought Indices (b) South Tarawa, Kiribati (continued) • Findings • The severity of the major 1998-2000 drought in South Tarawa was ranked against other historical droughts, as follows: • Rainwater tanks: worst on record for 4 months, lowest 2% for 6 months • Domestic wells: lowest 3% for 12 month period • Public water supply system: lowest 17% for 5 year period • The 5 year rainfall accumulation times for large freshwater lenses is consistent with the residence time for freshwater in the lens. • Further work is required re appropriate percentile levels for ‘onset of drought’ and ‘severe drought’ • Potential developments: • Update Drought Index each month with seasonal rainfall forecasts (as for Rarotonga) • Possibly use ENSO indicators to forecast groundwater salinity (collected since 1980)
Water Resources Data Requirements • Long-term, good-quality water resources data sets (preferably greater than 30 years) are required by models (e.g. SCOPIC) to develop direct relationships between climate predictors (e.g. SOI or SSTs) and water resources parameters. • Most Pacific Island countries do not have long-term water resources data sets • Need for ongoing water resources data collection programs. e.g.: • Streamflows & spring flows • Groundwater levels and salinity
Conclusions • Seasonal climate forecasting can be applied to a variety of water resources and water supply systems provided that suitable monitoring data is available. • The main application is in the area of drought forecasting and related management strategies. • SCFs have limitations in water resources applications (not apply to short and long term time scales of relevant hydrological processes) • Further development work required to apply SCFs to specific water sector issues. • Long-term, good quality water resources data is essential for analysing relationships between climatic and water resources data. • Need for continued operation (and expansion) of water monitoring networks. Thank you