Download
1 / 25
250 likes | 274 Views
Explore mass and energy exchange measurements using aircraft sensors and models on different spatial and temporal scales, techniques like Eddy Covariance and Relaxed Eddy Accumulation, and the analysis of turbulent fluxes. Delve into the importance of wavelet analysis for understanding flux contributions and mesoscale transport dynamics. Investigate energy budget closure implications for heat, CO2, and H2O flux measurements.

E N D
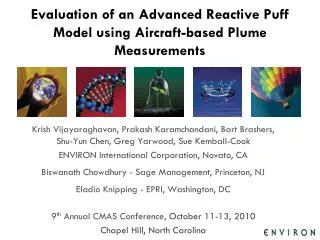
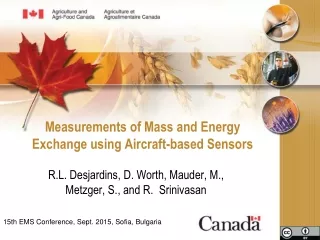
Measurements of Mass and Energy Exchange using Aircraft-based Sensors R.L. Desjardins, D. Worth, Mauder, M., Metzger, S., and R. Srinivasan 15th EMS Conference, Sept. 2015, Sofia, Bulgaria
Spatial and temporal scales of mass and energy exchange Length 102m 103 m 104 m 105 m 10 m Chamber Aircraft 1 h 100 h Tower Time Models 103 h 104 h
Flux Measurement Platform – The Twin Otter Aircraft Global positioning system antenna REA system Intake Console, keyboard & navigation system controls Litton 90 inertial reference system Dew point sensor Laser Altimeter Side-looking video camera Rosemount 858 (,, airspeed, altitude) Video camera Duct pressure, temperature sensors Altitude gyro Accelerometers rate gyros Gas analyzers (CO2, CH4, H2O, O3) Radio altimeter Data recorder Satellite simulator Greeness indicator (CO2, CH4, N2O, VOC, agrochemicals)
The Eddy Covariance Method Reynolds: Flux: scalar vertical wind velocity vertical wind velocity scalar 0 10 20 30 40 Time (with tower) or distance (with aircraft) . . x EC technique is a useful tool because it permits to quantify fluxes for an entire ecosystem without disturbing it. It is based on assumptions of stationarity and horizontal homogeneity. The temporal mean may not be spatially representative due to large-scale organized structures.
Relaxed Eddy Accumulation (REA) • Alternate to eddy covariance technique to measure fluxes of trace gases for which fast-response analyzers are not operational (N2O) • Air samples from updrafts and downdrafts are collected in two separate reservoirs for later analysis • In EA, sample flow rate is proportional to w; this requirement is ‘relaxed’ in REA (i.e., full flow into up or down reservoir depending on the direction of the vertical wind) Desjardins et al. 2000
CO2 flux measurements during FIFE, 1989 CO2 Fluxes (kg CO2 ha-1 h-1) Measurements of carbon dioxide absorption over a 15 km x 15 km grassland site using the NRC Twin Otter aircraft. The data is superimposed on a satellite image.
Evapotranspiration measured using the Twin Otter aircraft over the Konza Prairies during FIFE
Tower and Aircraft Flux Measurements sensible and latent heat USA QH QH QH QE QE QE SGP project 1997
AC / Tower Comparison of Sensible Heat Fluxes (line 8) 200 1:1 Whole run, 12 km Segment, 2.8 km 150 Aircraft (W m-2) 100 50 0 0 50 100 150 200 Tower (W m-2)
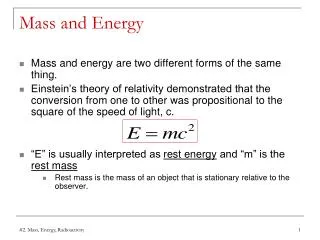
Lack of energy budget closure: Implications for sensible heat, CO2 and H2O flux measurements? From the basic energy balance equation, Qn – QG – ΔQS = QE + QH However, experimentally it has generally been found that on a short time scale (hours) Qn – QG – ΔQS> QE + QH
Lack of Energy Budget Closure turbulent energy fluxes: QH + QE (W m-2) available energy: -Q*s – QG (W m-2) 22 European sites: residual of 20% of the available energy on average (Wilson et al. 2002) Are we underestimating the CO2 flux as well? Energy Balance at 6 European forest sites (Aubinet et al., 2000)
Mesoscale Circulation QH T < [T], w < [w] QH > 0
An example of the long term impact of surface heterogeneity on mass and energy exchange- 56 passes (Desjardins et al. 1997) Desjardins, R.L., MacPherson, J.I., Mahrt, L., Schuepp, P.H., Pattey, E., Neumann, H., Baldocchi, D., Wofsy, S., Fitzjarrald, D., H. McCaughey and D.W. Joiner. 1997. Scaling up flux measurements for the boreal forest using aircraft-tower combinations. J. Geophys. Res. 102: 29,125-29,134.
Handling of nonstationary conditions Mesoscale contribution Turbulent flux Eddy flux wavelength
Candle Lake – Wavelet analysis Why wavelet analysis? • Does not require stationarity and homogeneity (in contrast to Fourier analysis) • Gives quantitative information, where in space and on what wavelength flux contributions occur • Allows to distinguish between small-scale turbulence and mesoscale fluxes (< > 2 km) • Allows to compute fluxes at a relatively small spatial resolution ( 1 km) without neglecting flux contributions from longer wavelengths • With wavelet analysis the residual term is substantially reduced
Candle Lake – Wavelet analysis Canada Analysis of low-frequency flux contributions as reason for the underestimation of eddy-covariance fluxes: Wavelet analysis of aircraft measurements 115 km
Candle Lake – Wavelet cross-scalogram Logarithmic wavenumber (m) Flight 1 BOREAS 1041 – 1116 CST 25 May 1994 Legend Positive flux contribution Near zero flux Negative flux contribution Mauder, M., R. L. Desjardins, and I. MacPherson. 2007. Scale analysis of airborne flux measurements over heterogeneous terrain in a boreal ecosystem. J. Geophys. Res., 112, D 13112, doi: 10.1029/2006JD008133. Distance (km)
How important is mesoscale transport in the surface layer? Candle Lake Runs (BOREAS/BERMS) at 30 m measurement height 20 flights analyzed • 5 – 20% mesoscaleflux contribution (2 km) Mauder, M., R. L. Desjardins, and I. MacPherson. 2007. Scale analysis of airborne flux measurements over heterogeneous terrain in a boreal ecosystem. J. Geophys. Res., 112, D 13112, doi: 10.1029/2006JD008133.
Mesoscale flux contributions (i.e., wavelength > 2 km) in % of the flux averaged over the entire flight track Mauder, M., R. L. Desjardins, and I. MacPherson. 2007. Scale analysis of airborne flux measurements over heterogeneous terrain in a boreal ecosystem. J. Geophys. Res., 112, D 13112, doi: 10.1029/2006JD008133.
Measuring nitrous oxide emissions cereals pasture/grass alfalfa forest soy corn town LEGEND
Canada Regional N2O fluxes during and right after snowmelt at the Eastern Canada study sites in 2001 e.g. REA can be used to measure the regional (≈50-100 km2) flux of N2O from agricultural land. Each data point represents the average of 3 samples, collected during two consecutive 10 km flight legs (total flight distance for one data point is ≈ 20 km). After accounting for 20% of the indirect N2O emissions (not considered by models such as DNDC) cumulative N2O emission estimates between the DNDC model and measurements were comparable. Mixed farmland Source:Desjardins, R.L., Pattey, E., Smith, W.N., Worth, D., Grant, B., Srinivasan, R., MacPherson, J.I., and Mauder, M. 2010. Multiscale estimates of N2O emissions from agricultural lands. Special Issue of Agriculture and Forest Meteorology 150 (6) 817-824.
The NRC Twin Otter Instrumented nose boom CH4 Analyzer (G2301) and real-time display in-flight REA sample collection & post-flight REA sample analysis using Picarro G1301
Summary • Aircraft-based flux measuring facility based on EC and REA techniques • A powerful tool to measure mass and energy exchange over a wide range of ecosystems • Presented flux measurements for CO2, CH4, N2O, H2O and O3 • Energy budget closure – a poor validation tool. • Mesoscale flux contributions have a similar magnitude as the flux underestimation by tower-based systems