Download
1 / 35
350 likes | 378 Views
GLOBIO3 model developed by Netherlands environmental assessment agency, UNEP-WCMC & UNEP GRID ARENDAL calculates biodiversity abundance relative to primary vegetation. Explore impact of driving forces, pressure factors, and biodiversity loss scenarios in Kenya to support policy decisions.

E N D
Application of GLOBIO3 Biodiversity Modelling to KENYA 2ND JANUARY 2007 MOSES MALOBA
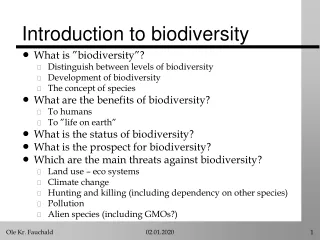
GLOBIO 3- Developed by Netherlands environmental assessment agency (MNP), UNEP WCMC & UNEP GRID ARENDAL Globio3 –Describes biodiversity by calculating remaining mean species abundance of original species relative to their abundance in primary vegetation (pristine condition) Model considers various pressure factors (driving forces) that are either direct or indirect
MODEL DESIGN • The core of the model is the description of the major relationships between the pressures/ drivers and their impacts on biodiversity • Biodiversity of an ecosystem is considered as a stock entity i.e. the complete set of characteristic species & their abundance. • Drivers are divided into two • Dependent • Independent
MODEL INPUTS • Land use (agriculture, forestry, settlement) • Climate change • Infrastructure • Fragmentation • Nitrogen Deposition
Design of model framework for GLOBIO3 IMAGE GLOBIO 2 GLC 2000 Climate Nitrogen Land use Infrastructure Patch size effect Infrastructure effect Climate effect Land-use effect Nitrogen effect GLOBIO3 MSA
Results from individual pressures are then combined and overall change in biodiversity calculated as Mean species abundance (MSA)Globio3 model depend on other models for some of the input data-IMAGE &Globio2
THE PROCESS OF BIODIVERSITY LOSS 100% Biodiversity decrease Map color 50% 0%
GLOBIO3 OUTPUT • Maps • figures • tables
PRELIMINARY RESULTS NATIONAL MSA MAP OF KENYA MSA GRAPH FOR 8 PROVINCES
The Wildlife Conservation Problem Loss of genetic biodiversity Decline in Wildlife population Drought and diseases PAC Poaching Increased Poverty Habitat loss Human-wildlife conflict Cultivation in Wildlife areas High population growth
Key policy questions relevant to KWS • What are impacts of pressures on species, ecosystems & ecosystem goods and services? • Where are the changes occurring?
Expansion of Agriculture : 1981-2000 3 3 2 2 1 1 7 7 4 4 6 5 5 6 Notable land use changes at: 1 –Transmara; 2-Narok-Nakuru; 3-Laikipia-Samburu; 4-Chyulu-Ngai Ndeithya; 5-Taita; 6- Coastal strip; 7-Tana PNR
What are the key pressure factors contributing to biodiversity loss?
NATIONAL BIODIVERSITY MODELLING SUPPORT TO POLICY MAKERS African group Robby, Carla and Moses Enschede, ITC June 29, 2007
Scenario 1: OECD baseline (IMAGE results) CLUE (Conversion of Land Use and its Effects Lu demands • Increase of agricultural area demands (39%) • Reduction of forest and woodlands (10%) • Reduction of shrublands (39%) • Reduction of Grasslands (27%) Policy option for conservation • Complete Protection of all the reserves
2000 2030 0 – permanent crops 1 – intensive agriculture 2 – extensive agriculture 3 – forest 4 – woodland 5 – scrubland 6 – grassland 7 – others
2000 2030 0 – permanent crops 1 – intensive agriculture 2 – extensive agriculture 3 – forest 4 – woodland 5 – scrubland 6 – grassland 7 – others
TRENDS FOR KENYA 2000 – 2030 SCENARIO 2 POLICY: Increase intensive agriculture by 5% & reduction in extensive agric by same. Increasing in agriculture by 30% (extensive and intensive combined). Keeping proportion constant between extensive and intensive from the beginning Increasing in perennials by 10% Increasing in built up areas by 15% Decreasing in savannas and natural areas Conversions into agriculture and built up areas are not permitted inside protected areas
RESULTS FOR SCENARIO 2 2000 2015 2030
Results communication_ Policy makers Target Organisations : Environment Government Departments – e.g. and Natural Resources Management, etc. Policy Mandate Environmental conservation – Biodiversity (Fauna and Flora), water.
Policy Target - Environmental Conservation Policy Geo-Information and biodiversity Modeling can benefit this Policy • Spatial and temporal visualization of biodiversity status • Data Integration from different sources (socio-economic, biophysical, administrative, etc) • Results are aggregated and presented in a series of clear, communicative and policy relevant indices and indicators. • Use of scenarios to project future trends • Test different policy option outcomes • Supports decision making at both national and local levels • Scenarios for the future are relevant for policy formulation over a range of spatial scales from local to National and global.
Which areas are most vulnerable to Biodiversity loss (hot spots)? What is the relative importance of the different pressures (and interactions)? What trends in land use patterns can be expected (under various scenarios)? What are the likely effects of various response options, i.e. policies and strategies What is the rate of biodiversity loss (in terms of targets) in the future? Key questions – Addressed by Modelling
Information that can be provided Current biodiversity status Per region Per pressure factor
Future Biodiversity Trend 2030 2000
Combining all Layers: Poverty and Competing Demands for Ecosystem Services in the Upper Tana River Basin Meru National Park Mt. Kenya Tana R. Aberdare Range Tana R. Sources: Kenya Central Bureau of Statistics, International Water Management Institute, Africover – Food and Agriculture Organization of the United Nations, Kenya National Environment Management Authority, and World Conservation Monitoring Centre.
Role of our organizations and supporting Partners • Provision of information to support policy • Create awareness on importance of biodiversity conservation • Conduct research and communicate the results • Ensure sustainability of the GI and Biodiversity Modelling