Download
1 / 24
240 likes | 337 Views
Rochester City School District 2010 Symposium Improving Student Achievement While Overcoming Adversity. Kent Gardner, PhD, President Center for Governmental Research. Practical Educational Program Evaluation. Challenges & Issues Examples 2001 WIN Schools Evaluation

E N D
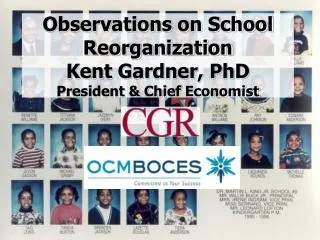
Rochester City School District 2010 Symposium Improving Student Achievement While Overcoming Adversity Kent Gardner, PhD, President Center for Governmental Research
Practical Educational Program Evaluation • Challenges & Issues • Examples • 2001 WIN Schools Evaluation • 2005 Rochester Charter Schools • Harvard NYC Charter • Stanford National Charter • Middle College • Hillside Work-Scholarship Connection
What’s the goal? • What’s the goal? • Middle College: College prep • Hillside Work-Scholarship Connection (HWSC): “Graduation is the Goal” • Who decides? • What if the endeavor has multiple goals? • Can you monitor progress by measuring intermediate or process goals?
What does success look like? • Does the goal have a measurable outcome? • Graduation is relatively easy to measure • How do you measure college readiness? • Are there intermediate outcomes that are measurable? • Attendance • Credits accumulated • Which intermediate outcomes contribute most powerfully to the final outcome?
Data Pitfalls • Why were the data collected? • Unemployment insurance • NYS’s checkbook • School lunch • If you intend to adapt data to a new use, are they accurate enough for the new purpose?
Data Pitfalls • Bias/Fraud • High stakes tests: NYSED cut scores • Attendance • Suspensions • Consistency • Elementary grades across classes, schools • Coding across years • Coding across data systems—attendance can vary depending how & when measured
Assessing impact • Consider how the program affects outcomes—really want to compare how the outcomes for individual students would have been different had they not participated • Instead, we compare outcomes for the “experimental” group (HWSC or Middle College participants, for example) to those of students who did not participate • Challenges • What’s the comparison group? All others who might have participated? • Can you control for all differences?
Matched Group Comparison • Experimental design is the “platinum standard” • Random assignment to either control or experimental group • “Double blind” to avoid placebo effect • Assignment from homogeneous population • Random assignment • Challenging—how do you find a context in which you can randomly select • Costly—if you want to be sure of drawing from a homogeneous population, you need a big sample
Fallback from random assignment • When random assignment infeasible or too costly, revert to “quasi-experimental” design: “Control group” is created by a process of selecting similar students • Case Control: match one to one based on common characteristics • Propensity Score Matching
Propensity Score Matching • Sophisticated statistical technique: Creates a statistical model that predicts group membership according to available characteristics of participants • “Retroactive” selection of control group: Can employ large data sets, including demographic characteristics, test scores prior to program participation, etc. & guarantee a control group of a predetermined size • Students “in program” can be matched to multiple students not in program—1:1, 1:3, 1:5 matching proportions possible depending on size of comparison population • Still can’t control for unseen factors—family characteristics, motivation, etc.—that may be consistently different in one group over the other
‘01:Wegman Inner City Voucher (WIN) • 98% of enrolled students in 6 inner city Catholic schools supported by WIN vouchers • Case control model matching WIN students with demographically-comparable students from RCSD “schools of choice” (15, 20, 57, 58) • Intended to acknowledge motivational difference between Catholic & public school families • Matched on age, sex, race, F/RPL, mother’s education • Poverty higher at WIN schools • Comparisons? • Compared Iowa Test of Basic Skills trend performance against ITBS national norms • Common assessment across schools was 4th grade ELA & Math scores for both WIN and schools of choice • Couldn’t adjust for “starting point” as conversion from Stanford 9 to ITBS unreliable • Conclusion: WIN and students from schools of choice performed about the same on 4th grade ELA & Math
‘05: Rochester Charter Schools • CGR engaged by Gleason Foundation to monitor performance of newly-formed charter schools for first five years (beginning 2000) • Expect “selection bias” for charter lottery applicants? Motivation, prior achievement • Solution: Follow students not accepted by lottery • RCSD facilitated monitoring of state & local tests for students enrolled in charter schools & in lottery, but remaining in traditional schools • Created “value added” achievement using scores from year prior to enrollment for both groups • Findings • Attrition in both groups made comparisons difficult • Yet findings supported conclusion that two large charter schools (Edison & National Heritage) underperformed RCSD schools • Both schools were closed by NYS Charter Schools Institute
Harvard School of Ed (Caroline Hoxby): New York City Charter Schools • Adopted same approach used by CGR in 2000: “lotteried in” v. “lotteried out” • All lottery participants more black (64% v. 34%), more poor (F/RPL 92% v. 72%) than all NYC public school students • Hispanic 29%/38% • ELL 4%/14%; SPED 11%/13% • Different in other ways? • Findings • “Lotteried out” students remained on grade level in traditional NYC public schools, outperforming NYC students similarly disadvantaged • “Lotteried in” did better • Key point: Studying only students who were part of a lottery “controls” for unseen factors like family motivation, etc.
Stanford CREDO (Mackie Raymond): Multistate study • Employed state administrative records to create “pairwise comparison” of individual students in 15 states • Matched on grade‐level, gender, race/ethnicity, F/RPL, ELL, SPED, prior test score on state achievement tests • Profile • 27% black, 30% Hispanic • 7% ELL, 7% SPED • 49% F/RPL
Middle College • RCSD/RIT program aimed at “college readiness” for three Franklin high schools • Measurement problematic—How define college readiness? • How assess college readiness? • Agreement on goals and objectives varied across RCSD & RIT faculty • One measurement idea, “before and after” ACCUPLACER scores, proved unrealistic • CGR’s role evolved to be more about process than outcome
Hillside Work-Scholarship Connection • Focus on critical output indicator: Graduation rates • Through 2005-06, CGR studies based on one-to-one match of HWSC participants to RCSD students • Matching conducted by individuals on Accountability staff • Matched on by age, gender, race/ethnicity, F/RPL participation, grade, prior year GPA
HWSC: Propensity Score Matching • New study for students whose “on time” graduation years were 2007, 2008 and 2009 • Relied on very high level of cooperation w/ Accountability • HWSC participants matched to nonparticipants by age, gender, race/ethnicity, poverty status, disability, English language learner status, grade, school quality, prior year GPA, prior year attendance, prior year suspensions, prior year state test scores
HWSC: Propensity Score Matching • Grouped students in two ways • By entry grade (8th, 9th, or 10th) & on-time graduation year (2007, 2008 or 2009) for NINE groups or “cohorts” • Groups are more homogeneous • “Graduation” has a consistent definition • BUT the groups are smaller • By enrollment year (02-03 through 06-07) across all grades for THREE cohorts • HW-SC enrollment practices more consistent • Groups are larger • BUT graduation standards will vary
Propensity score matching complexity • Considered many variations • Matched 1:1, 1:3, & 1:5 RCSD student(s) to each HWSC student • Studied on-time, on-time + 1yr graduation • 2 probability distributions: logit v. probit • 108 model “runs” (12 variants by 9 cohorts) • 95% confidence interval: The true value will lie within the interval 95% of the time
Final statistical comments • Statistical significance • How often would this result occur by chance? • 95% confidence interval: Given the size of the sample and an unbiased sampling procedure, the true “population parameter” will fall within this range 95 times out of 100 • 99% confidence interval: true “population parameter” will fall within this range 99 times out of 100 • “Effect size” or importance of result