Download
1 / 41
410 likes | 518 Views
The Role of Taxes and Education Funding in Charting Michigan’s Economic Future:. Richard G. Sims Sierra Institute on Applied Economics Carson City, Nevada November 2006. A quick look at Michigan state and local tax effort, by taxpayer income catagory. Richard G. Sims

E N D
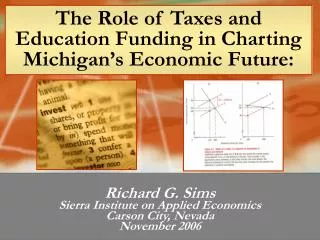
The Role of Taxes and Education Funding in Charting Michigan’s Economic Future: Richard G. Sims Sierra Institute on Applied Economics Carson City, Nevada November 2006
A quick look at Michigan state and local tax effort, by taxpayer income catagory Richard G. Sims Sierra Institute on Applied Economics
Michigan Taxes Source: Who Pays?: A Distributional Analysis of the Tax Systems of All 50 States, Second Edition, Institute on Taxation and Economic Policy, 2003. Richard G. Sims Sierra Institute on Applied Economics
…and how they have changed. Source: Who Pays?: A Distributional Analysis of the Tax Systems of All 50 States, Second Edition, Institute on Taxation and Economic Policy, 2003. Richard G. Sims Sierra Institute on Applied Economics
FY 2004-2005 Source: Michigan Department of Management & Budget, Comprehensive Annual Financial Report, and Senate Fiscal Agency, Updated March 2006.
What Public Policies Influence State Economic Growth? Richard G. Sims Sierra Institute on Applied Economics
Do low business taxes lead to economic growth? Richard G. Sims Sierra Institute on Applied Economics
Chart A: The 10 Fastest Growing States’ Corporate Income Tax Rates: Average7.1% NOTE: States in italic are "no income tax" states; Rates are in percent and are those in place 1/1/2004. SOURCE: Income data from U.S. Department of Commerce, Bureau of Economic Analysis; tax rates from Federation of Tax Administrators, www.taxadmin.org. Richard G. Sims Sierra Institute on Applied Economics
Chart B: The 10 Slowest Growth States’ Corporate Income Tax Rates: Average6.25% NOTE: States in italic are "no income tax" states; Rates are those in place 1/1/2004. SOURCE: Income data from U.S. Department of Commerce, Bureau of Economic Analysis; tax rates from Federation of Tax Administrators, www.taxadmin.org. Richard G. Sims Sierra Institute on Applied Economics
In fact, over the last decade… High growth states actually had comparatively high average corporate income tax rates. Slow growth states had corporate tax rates below the U.S. average. Richard G. Sims Sierra Institute on Applied Economics
But doesn’t being “Business Tax Friendly” or being seen as having a favorable Business Climate encourage a states economic growth? Let’s see-- Richard G. Sims Sierra Institute on Applied Economics
Chart A: States ranked MOST ‘Business Tax Friendly’ Tax Foundation Rankings SOURCE: Tax Foundation, Inc.,State Business Tax Climate Index Richard G. Sims Sierra Institute on Applied Economics
Chart B: States ranked LEAST ‘Business Tax Friendly SOURCE: Tax Foundation, Inc.,State Business Tax Climate Index Richard G. Sims Sierra Institute on Applied Economics
In addition, the Actual Effective Rates that Corporations pay on their Profits has Declined Substantially Over the Last Several Years… Richard G. Sims Sierra Institute on Applied Economics
Source: Data from Federation of Tax Administrators and the U.S. Department of Commerce. Richard G. Sims Sierra Institute on Applied Economics
How about the effect of the overall “Business Climate”… Richard G. Sims Sierra Institute on Applied Economics
Only 7 of the Top Ranked 25 states grew as fast a the US average- Only 2 of the Top Ranked states were in the top 10 growth states- 7 of the Top Ranked states were among the 10 slowest growing states. Site Selection magazine, Nov. 2006; Bureau of Labor Statistics website; calculations by the author.
One Reason Corporate Income Taxes Don’t Have Much Influence on State’s Comparative Growth- Rates Don’t Vary Greatly from State-to-State-- Richard G. Sims Sierra Institute on Applied Economics
State Corporate Income Tax Rates Maximum Corporate Tax Rate ¾ of states have rates between 6%-9% IOWA Mid-Point 7.5% MINNESOTA ILLINOI S WISCONSIN The 45 States with a Corporate Income Tax Richard G. Sims Sierra Institute on Applied Economics
From the previous chart Lowest rate– Kansas, 4%: growth rank 26th Highest rate—Iowa, 12%: growth rank 27th Richard G. Sims Sierra Institute on Applied Economics
Another Reason Corporate Income Taxes Don’t Determine a State Economic Growth… Richard G. Sims Sierra Institute on Applied Economics
Richard G. Sims Sierra Institute on Applied Economics Source: U.S. Department of Commerce, National Income and Product Accounts, 2003.
What Firms Say Are Their Major Cost Considerations When Relocating Source: Robert M. Ady, “The Effects of State and Local Public Services on Economic Development,” New England Economic Review, March/April, 1997. Richard G. Sims Sierra Institute on Applied Economics
Similarly, taxes on individuals don’t appear to determine states’ growth… Richard G. Sims Sierra Institute on Applied Economics
In general, states with high economic growth had relatively higher taxes. Richard G. Sims Sierra Institute on Applied Economics
Elementary & Secondary Spending Average growth for the 50 states and DC: 4.1% SOURCE: Education spending data from National Center for Education Statistics, http://nces.ed.gov; income data from U.S. Bureau of the Census, Bureau of Economic Analysis.
ELASTICITIE$ How revenues grow over time determines states’ ability to fund futureservices- Typical Long-Term 50 State Averages Personal Income Tax 1.04 Corporate Income Tax 0.95 Sales Taxes 0.97 Property Taxes 0.96 Cigarettes (avg. all states) 0.48 Lottery (avg. all states) 0.52 These all grow slower than the economy Richard G. Sims Sierra Institute on Applied Economics
Heavy reliance on sales and excise taxes and lotteries constrain state’s ability to fund future services, many of which are crucial to economic growth and development.
A look at economic interaction between taxes, spending and state economic growth.
A Dynamic General Equilibrium Analysis of a Balanced Budget Tax and Spending Increase Richard G. Sims Sierra Institute on Applied Economics
A Dynamic General Equilibrium, Balanced Budget Analysis of Proposal 5 Source: Richard Sims, using the REMI economic model for Michigan.
Source: The Long-Term Effects of TABOR on the Michigan Economy, Sierra Institute on Applied Economics, September, 2006..
Source: The Long-Term Effects of TABOR on the Michigan Economy, Sierra Institute on Applied Economics, September, 2006..
Source: Tax Limitations, Education Funding Measures and Economic Growth: A Look at Michigan, Sierra Institute on Applied Economics.
Source: The Economic Impact of the Georgia Lottery, Carl Vinson Institute of Government, University of Georgia.
“I know of no valid economic theory that suggests that tax cuts provide more economic stimulation than would a similar amount of government spending.” Former Congressional Budget Office Director, Robert Reischauer Richard G. Sims Sierra Institute on Applied Economics
So, why does education spending have such a large impact on job creation? Near-Term: -Labor intensity -Local purchase intensity -Larger share of total business costs Long-Term: -Amenity value -Source of productivity -Source of competitiveness Richard G. Sims Sierra Institute on Applied Economics
A Concern for Michigan’s Future Over the decade of the 1900’s, Illinois lost 121,000 college graduates to other states. Richard G. Sims Sierra Institute on Applied Economics
CONCLUSIONS • Low taxes are not the key to creating jobs and income in a state. • Low taxes are associated with low levels of public services. • Spending on K-12 education can be a significant contributor to economic growth. Richard G. Sims Sierra Institute on Applied Economics


![The ONCE and FUTURE [e-] JOURNAL](https://cdn0.slideserve.com/1357417/the-once-and-future-e-journal-dt.jpg)