Road Network Evaluation Tools: Overview , Main C oncepts, Applications
540 likes | 720 Views
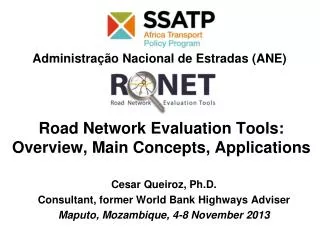
Administração Nacional de Estradas (ANE). Road Network Evaluation Tools: Overview , Main C oncepts, Applications. Cesar Queiroz, Ph.D. Consultant, former World Bank Highways Adviser Maputo, Mozambique, 4-8 November 2013. RONET Overview, M ain Concepts, Background and Applications.

Road Network Evaluation Tools: Overview , Main C oncepts, Applications
E N D
Presentation Transcript
AdministraçãoNacional de Estradas (ANE) Road Network Evaluation Tools:Overview, Main Concepts, Applications Cesar Queiroz, Ph.D. Consultant, former World Bank Highways Adviser Maputo, Mozambique, 4-8 November 2013
RONET Overview, Main Concepts, Background and Applications • Infrastructure and economic development • Optimization defined • A common concern: how to optimize maintenance and rehabilitation • What is required for an agency to use RONET? • RONET structure • RONET applications • Next steps
Infrastructure • “The built environment in which we live” (Ausubel and Herman) • The physical framework upon which the economy operates and our standard of living depends (ASCE)
Infrastructure comprises • Public utilities: power, telecommunications, piped water supply, sanitation and sewerage, solid waste collection and disposal, piped gas • Public works: roads, dams, canals, railways, ports, waterways, airports, buildings
Developing and Developed Countries • Developing countries include low- and middle-income economies • Developed (advanced, industrial, rich) countries denote high-income economies • The World Bank’s main criterion for classifying economies is gross national income (GNI) per capita, previously referred to as gross national product (GNP) • http://data.worldbank.org/indicator/NY.GNP.PCAP.CD
Classification of Economies Economies GNI per capita Low-income $1,035 or less Middle-Income $1,036 to $12,615 Lower $1,036 to $4,085 Upper $4,086 to $12,615 High-income $12,616 or more Source: http://data.worldbank.org/about/country-classifications
Examples of Gross National Income GNI, $/cap
Examples of Gross National Income (cont’d) GNI, $/cap
Economic Development and Infrastructure GNI ($/pop) GNI = 1.39 PRD R squared: 0.76 98 countries Source: Queiroz and Gautam
Abrir estradas para fazer chegaro desenvolvimento Source: Domingo, Maputo, 3 November 2013
Optimal Road Condition Total Road Transport Costs Budget, Costs $ Road Agency Budget Too Large User Costs Optimal Too Small Too Poor Optimal Too Good Road Condition
Road Network Evaluation Tools • RONET, developed by Rodrigo Archondo-Callao for SSATP, helps decision makers to: • Monitor network condition • Plan allocation of resources, including optimizing road network maintenance and rehabilitation • Assess consequences of macro policies • Design Road Asset Management Systems
Road Network Evaluation Tools • Availability: RONET is available free of charge on the World Bank website at: http://go.worldbank.org/HWVR0FWEF0 http://go.worldbank.org/FF0CT8M770 • General use: RONET can be used in any city, country or region, for paved and unpaved road networks, provided that appropriate data are available • Version 2.00 – latest version, published in 2009
What is Required for an Agency to Take Advantage of Tools Such as HDM-4 and RONET? • Updated road inventory and condition data, e.g., length of roads in each category, pavement structure, road roughness • Traffic data, e.g., volumes by vehicle category, weight of heavy vehicles • Road user cost data, e.g., price of new vehicles, fuel consumption and cost • Unit cost of road works, e.g., rehabilitation ($/km), new construction ($/km)
Road Network Length Matrix Total 5 X 5 X 5 X 5 = 625 Road Classes
International Roughness Index (IRI) • Main road condition indicator used by models such as RONET and HDM • A standard scale used throughout the world to quantify the roughness of roads • The IRI summarizes the roughness qualities that impact vehicle response (such as vehicle vibration) • It relates to overall vehicle ride, operating cost, dynamic wheel loads, and overall surface condition
Development of IRI • The International Road Roughness Experiment, Brasilia, Brazil, 1982 • Reference: World Bank Technical Paper No. 45, “The International Road Roughness Experiment: Establishing Correlation and a Calibration Standard for Measurements,” available at: http://go.worldbank.org/0UUNR93490
IRI Meaning and Uses • IRI is determined by measuring the profile along the wheel paths of the road, and then filtering the profiles through a quarter-car mathematical model to simulate the suspension deflection of a passenger car • Its uses include assessing road condition and as a construction specification
IRI Calculation from Road Profiles • “ProVAL” - Profile Viewing and AnaLysis - an engineering software used to view and analyze pavement profiles, including IRI calculations • Sponsored by the US Federal Highway Administration (FHWA) • Available free of charge from: http://www.roadprofile.com/
IRI Calculation from Road Profiles • “RoadRuf” – a tool for computing IRI, available from the University of Michigan at: http://www.umtri.umich.edu/divisionPage.php?pageID=62 • RoadRuf includes an interactive X-Y plotter and a spectrum analyzer • A sample program for calculating IRI is available at: http://www.umtri.umich.edu/content/IRIMain.f 22
RONET Paved Road Deterioration Model • RONET uses simplified incremental road deterioration model for paved roads: • traffic loading (YE4) • pavement modified structural number and • subgrade bearing capacity (SNC) • pavement age (t) • environmental coefficient (m) • existing condition (IRIa)
Road User Costs Model • Expressed as a polynomial function of roughness for each vehicle category • Developed using World Bank RUCKS (Road User Costs Knowledge System) model URUC - unit road users’ cost ($/vehicle-km) IRI - pavement longitudinal roughness (m/km) a0, a1, a2, a3 - model coefficients that depend on input data (e.g., new vehicle, fuel and tire costs)
Example of IRI and Road Condition • Very good: IRI less than 2.5 m/km • Good: IRI from 2.5 m/km to 3.5 m/km • Fair: IRI from 3.5 m/km to 5.5 m/km • Poor: IRI from 5.5 m/km to 10.5 m/km • Very poor: IRI higher than 10.5 m/km
Types of Road Network • Five or less network types can be defined by the user based on functional classification, region, terrain type, or environmental type 32
Surface Types • RONET uses five surface types. The country specific characteristics of the surface types are user defined 33
Road Condition Categories • Very Good: requires only routine maintenance (RM) • Good: requires RM plus preventive maintenance or spot regravelling or repairs • Fair: requires RM plus periodic maintenance • Poor: requires RM plus strengthening or partial reconstruction • Very Poor: requires RM plus full reconstruction 35
RONET Main Input Data • Length of road sections (per category, traffic, condition) comprising the network • Unit cost of road works • Selected country data (e.g., discount rate, fuel cost, salaries, vehicle fleet, traffic growth rate) 36
Performance Assessment What are the consequences of different budget scenarios?
RONET evaluates alternative maintenance and rehabilitation road works standards for each road class Road Work Standards
Optimal Standard RONET determines optimal standard per road class Least Total SocietyCosts
Consequences to Road Network Condition: Roughness (IRI in m/km)
RoadWorksDetails(M$) Other Tables for:($/km-year)($/veh-km)(km/year)per surface classand surface type
Next steps • Review RONET’s User Guide • RONET familiarization interactive exercise • Obtain as realistic as possible information on a road network of each participating country • Develop an optimum road network M&R program for the selected network • Prepare a brief report and present the results
Cesar QueirozSSATP/World Bank ConsultantFormer World Bank Highways AdviserTel +1 301 755 7591queiroz.cesar@gmail.comWashington, DC, USA