Download
1 / 14
140 likes | 325 Views
State of Freight Data & Models: Rail, Truck-Load (TL) & PickUp & Delivery (PUD) Alain L. Kornhauser Professor, Operations Research & Financial Engineering Director, Program in Transportation Faculty Chair, PAVE (Princeton Autonomous Vehicle Engineering) Princeton University Presented at

E N D
State of Freight Data & Models: Rail, Truck-Load (TL) & PickUp & Delivery (PUD) Alain L. KornhauserProfessor, Operations Research & Financial EngineeringDirector, Program in Transportation Faculty Chair, PAVE (Princeton Autonomous Vehicle Engineering) Princeton University Presented at Adapting Freight Models and Traditional Freight Data Programs for Performance Measurement Workshop April 30, 2013
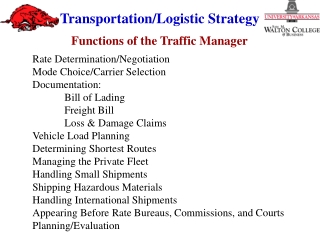
Supply Side • Digital Map Databases: • Roadway (Positives): • Well developed with substantial detail • Developed, maintained and distributed by the private-sector • Essentially all roads, “all” the attributes • distance, lanes, speed limits, historic volumes, address ranges, … • Current travel times essentially everywhere • historic statistical distributions for many • Can reliably compute paths and tours • Roadway (Challenges): • MUST use ones with truck-specific attributes • PC*Miler network is the standard • Travel time forecasts remain a challenge • Incidents are tough to predict • Stochastic route choice remains a challenge • Trading off risk and reward.
Supply Side • Digital Map Databases: • Railway (Positives): • A somewhat detailed network exists () • Developed, maintained and distributed by the private-sector • ALK’s PC*Rail is the standard • All major and most minor RRs in NA, “Some” the attributes • distance, ownership, trackage rights, interchange pts, freight stations, grade, track quality… • Can reliably compute paths (“flow” traffic), competitive and cooperative routes, URCS-type costs, • Roadway (Challenges): • Detailed Operations-oriented network databases exist @ each Railroad • Proprietary! • Travel time forecasts remain a challenge • Each railroad has the data but it is held very closely.
Supply Side • Vehicle Performance/Cost Models: • Pretty good for both trains and trucks. • Fuel consumption, pollution, environmental, speed, accident propensity, etc. • Example: Uniform Rail Costing System (URCS) • Est. variable and total unit costs for Class 1 RRs • Pavement and Track Performance/Maintenance • Pretty good for both Pavement and track
Demand Side http://www.stb.dot.gov/stb/docs/Waybill/2010%20STB%20Waybill%20Reference%20Guide_JN.pdf • Historic Traffic A->B: • Railway (Positives): • Carload Waybill Sample (aka 1% waybill sample) • Excellent annual data since 1979, spotty pre 1979 • Stratified sample (closer to 2+% sample, includes unit trains) • Full route (O, O_RR, A, A_RR, B, B_RR, …, D, D_RR), car_type, commodity, weight, revenue, … (full waybill) • Sample accessible with appropriate permission for appropriate “legal” purposes • Public Use Waybill File available on-line • Roadway (Challenges): • Each Railroad has 100% waybill files that are excellent • Proprietary • but could be readily sampled • Not all that big given today’s “Big Data” + there are “few” RRs http://www.stb.dot.gov/stb/industry/econ_waybill.html
Demand Side • Historic Traffic A->B: • Roadway (Positives): • I can’t think of any • Roadway (Challenges): • Commodity surveys have been very challenging • Essentially every trucking company has detailed movement data similar to Carload Waybill Sample • Always had it bit now not paper, but data files. • Many now have “GPS” tracking data and activity at each stop • Some every 45 minutes, • others every 5 minutes, 2 min even 3 sec. • All proprietary and many trucking companies. • One “aggregator”: Freight payment companies • They get electronic bill of lading
What to do? • Supply Side: • Pretty good shape • Demand Side: • Obtain legislative mandate comparable to what the ICC got for the Carload Waybill Sample • “Crowd source” the demand Data????? • “Learning Algorithms” ????? • Nothing to “calibrate” against. • Intermodal: • Everything is Intermodal: • It is a logistics cycle: • from raw materials -> products -> consumers -> refuse -> recycleables