The Rise of CO2 and Global Warming: Science vs. Influence
Scientists have observed direct signs of climate change for decades, with data showing a rise in atmospheric CO2 levels and the impact on Earth's radiative balance. This comprehensive article delves into the science behind global warming, greenhouse gases, and the expected temperature rise due to CO2 emissions from fossil fuels.

The Rise of CO2 and Global Warming: Science vs. Influence
E N D
Presentation Transcript
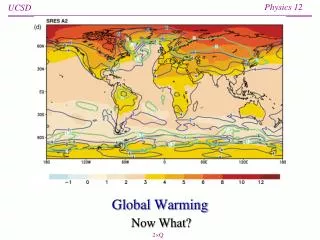
Global Warming Now What? 2Q
Science vs. Influence • Scientists have seen direct signs of climate change for decades • confidence has grown based on loads of data, often collected by scientists who are themselves skeptical about climate change • Scientific consensus is not as easy as you may think • practiced by humans, each interested in making a mark • scientists are by nature skeptical, and eager to tear holes in shoddy ideas • but in the end, driven by evidence, not emotion, authority, or pet ideas • Long after scientific consensus, waters were still muddied • overt influences by financial powers emphasized controversy and “lack of consensus” • and had a bigger bullhorn: popular media ran the controversy over the consensus, which has had a damaging delay-effect • fantastic article about conflict between capitalism and climate change: • http://www.thenation.com/article/164497/capitalism-vs-climate?page=full
The Rise of CO2 2.0 ppm/yr 400 ppm = 400 parts-per-million = 0.04%by volume just passed 400 ppm for first time in millions of years 1.85 ppm/yr reference Keeling, a researcher at Scripps Institute for Oceanography, started measuring atmospheric CO2 from Mauna Loa in Hawaii in 1958. Besides the annual photosynthetic cycle, a profound trend is seen. Q
What’s the Problem? • Adding CO2 to the atmosphere changes the radiative balance on earth • CO2 absorbs infrared light, so more of the thermal emission trying to escape from earth is absorbed in the atmosphere, causing earth to warm • it’s like the glass sheet over the solar hot water collector: like a greenhouse • eventually, a hotter earth radiates more prodigiously (according to T4 law), and balance is re-established
H2O and CO2: major greenhouse gases above the atmosphere but the thermal emission is farther out in infrared (IR) at ground level O2 H2O Atmospheric absorption H2O H2O, CO2 H2O, CO2
Absorption Bands and Blanket Effect • The atmosphere is pretty transmissive for visible light (incoming energy) • But the thermal infrared is significantly absorbed • mostly H2O; some CO2 and friends • Effectively absorbs 75% of the IR trying to get out • half of this re-radiated up, half back down • T4 = 390 W/m2 leaves the surface • but 150 W/m2 comes back as IR • this is the effect of having a blanket • Would be 255 K (18C) without any greenhouse effect • but instead a comfy 288 K (15C) • 21C of 33C difference is due to H2O, 7C due to CO2, 5C from “other” Q
Is this rise surprising? • Every gram of fossil fuel used produces 3 grams of CO2 • it’s straight chemistry: to get the energy out via combustion, the carbon from the hydrocarbon gets attached to oxygen and off it goes • How much should we expect? • global energy budget is 41020 J; pretend all from fossil fuels • average 10 Cal/gram ~40,000 J/gram 1016 g/yr F.F. • so 31016 g/yr CO2 31013 kg/yr CO2 • atmosphere has mass = 5.31018 kg CO2 adds 5.7 ppm/yr by mass • about 3.7 ppm/yr by volume (CO2 is 44 g/mol vs. 29 for air) • if half goes into ocean, half into atmosphere (as studies show), atmospheric rise is 1.85 ppm/yr, by volume • this is darned close to what we see on the “Keeling curve” graph
Total CO2 rise • We can do the same thing for the entire fossil fuel history • have gone through 1 trillion barrels of oil 140 Gtoe • Gtoe is gigaton (109 ton) oil equivalent (by energy) • used about 160 Gtoe coal worldwide • using 40 Gtoe U.S. times four, since U.S. uses 25% of world energy • used 1037 tcf natural gas in U.S. 27 Gtoe, so guess 100 Gtoe worldwide • 400 Gtoe of fossil fuels 1.21015 kg of CO2 (3 FF mass) • 228 ppm of atmosphere by mass; 150 ppm by volume • half into atmosphere 75 ppm increase • see 100 ppm increase (280 ppm pre-industrial to 380 ppm) • So the CO2 increase is absolutely expected! Q
Expected Temperature Rise • If you add to the blanket, expect to get warmer • How much warmer? • Historically we have a 7C effect from CO2 • Have gone from 280 to 400 ppm (10/7 times as much, or 3/7 increase) • This should translate into 73/7 = 3C change • but takes some time because oceans are slow to respond, having enormousheat capacity • Should be NO SURPRISE that burning loads of fossil fuels makes us warmer • not actually hard to understand!
Temperature record of the past Often called the “hockey stick” curve
300 275 250 225 200 175 4 2 0 -2 -4 -6 -8 -10 Today’s CO2 level!! Antarctic ice core records span 400,000 years • Cyclic climate change as we enter and leave ice ages • Tight correlation between temperature and CO2 • Never have seen CO2 levels over 300 ppm • until now (400 ppm)! • Some temperature spikes “briefly” warmer than now • but sea level was 15 feet higher in these periods • Current rate of temperature climb unprecedented in record (not visible here) Note: Greenland’s ice sheet is 110,000 years old: melted in last interglacial period.
History of Sea Level • Over the past four cycles, each lasting about 100,000 years, sea level rose and fell by about 400 feet, with ice ages having lower sea level and warm interglacial periods having higher sea level. • During the warmest part of the last interglacial period (about 130,000 years ago), global average temperature was 2–3 °F warmer than today and global sea level was 13–20 feet higher. • During the Middle Pliocene (3 million years ago), global temperature was 3.5–5.5 °F warmer than today and sea level was 80–115 feet higher. • If emissions of man-made greenhouse gases continue without abatement, the earth could warm by 5.5 °F (3 °C) within the next century. from http://www.pewclimate.org/global-warming-basics/slr.cfm
Sea Level After the Ice Age Note: this is a good example of real data: lots of measurements from different scientists around the world all pointing to similar (and sensible) results. Note also error bars.
Global Consequences • The earth’s ocean/atmosphere/ice system is very complex • it’s difficult to make predictions due to the interconnectedness • Naïve extrapolations say that by the end of this century, the global temperature will be 1.4 to 5.8 ºC warmer than today • this is a huge change! • Same predictions have oceans rising roughly half-a-meter by 2100, and several meters by 2300 • These predictions don’t account for all possible feedback scenarios
Fidelity of the Model • When all known influences are treated in a global model, our ability to reproduce the observed temperature record is quite good • not perfect, but the major features are captured • This gives scientists confidence that we can extrapolate to the future • unless a “tipping point” is crossed, triggering a dramatic, rapid change
Feedback Types: Positive can be bad! • Increasing temperatures could unleash a runaway process: positive feedback • Example of negative feedback (tendency toward stability) • warmer more clouds more reflection cooler • Examples of positive feedback: • warmer less CO2 absorption by water more greenhouse gasesgets warmer • colder more ice on planet more reflection colder • Note that feedback type doesn’t determine the direction, just whether the behavior self-reinforces and runs away • The open question is which type of feedback will dominate: positive feedback means runaway
Positive feedback contributors • Warm water has diminished ability to absorb CO2 • already “sharp drop” observed in Pacific CO2 • Melting Arctic ice darker water absorbs more sunlight warms up melts ice faster • Hotter soil means trapped CO2 is given off • More stable ocean (hot on top) starves plankton • they rely on nutrients swept up from bottom • net result: reduced activity means less CO2 absorbed • Thawing tundra wetlands more methane • a powerful greenhouse gas • Submarine methane-hydrates frozen in place are warmed out Q
The consensus view? • The majority view among climate researchers globally is that positive feedback is likely to dominate over negative feedback • but this isn’t being explicitly stated (published), as the uncertainties are still too high • good lesson of less-than-alarmist science community • From 1992 IPCC report (a rather conservative body): “Because natural sources and sinks of greenhouse gases are sensitive to a change in climate, they may substantially modify future concentrations [of greenhouse gases]. ... It appears likely that, as climate warms, these feedbacks will lead to an overall increase rather than a decrease in natural greenhouse gas abundances. For this reason, climate change is likely to be greater than the estimates we have given."
IPCC Assessments • The Intergovernmental Panel on Climate Change (IPCC) is a body of scientists tasked with providing the most robust analysis on climate change available • about 1000 scientists • emphasis is on consensus view of the most solid facts/data • as a result, the conclusions are very conservative • Have worked on four major assessments • third assessment in 2001; fourth in 2007; fifth in final preparation • can see products at: http://www.ipcc.ch/ • Explore a variety of scenarios as modifications to our current “business as usual” trend
Predicted Temperature Changes • The IPCC predicts an increase of 1.1ºC to 6.4ºC from 1990 to 2100 depending on scenario • Earth can be slow to respond, due to thermal sink of oceans, and this lag means the temperature will continue to rise even if we ceased burning fossil fuels today! • CO2 hangs around long enough that we would likely not see the end of changes until ~2300 • this is under scenario that we STOP fossil fuels tomorrow (not going to happen!) • sea-level rise is the gift that keeps on giving
Sea-level rise • Thermal expansion of water plus glacial and polar ice-cap melting raise the sea level • The oceans are predicted to rise something like half-a-meter by 2100, maybe as much as 1 meter • goodbye to much of Bangladesh, much of the Nile valley, Louisiana • Doesn’t stop there: it won’t stabilize until maybe 2300, by which time the rise could be several meters • this is even if we stop the CO2 production today
What’s the sea doing lately? current rate is 3 mm/year about a foot per century
IPCC Estimates on Sea Level A note of significance: none of these have yet stabilized as of 2100. Even the green curve (eliminating CO2 emissions by 2100) is still steadily climbing. This effect won’t play out until 2300 at least.
How are we responding? • Globally, the response has been encouraging • The U.S., however, has been egregiously reluctant to accept the consequences • doing so would impact “our blessed way of life” • not surprising that the worst offenders/contributors are behaving the least responsibly • A tragic human epitaph: • We wanted to save the world, but our leaders told us it would be too expensive • Result: Business as Usual 2Q
Other observations of global warming • The earth is slowing down as polar ice melts and redistributes into the oceans • like an ice-skater slowing down by holding arms out • Sea level rise, at rate of 3 mm/year • Arctic Ice Cap melting faster than most dire predictions • Glaciers retreating • Satellite monitoring of global temperature from 1980–1999 (deduce 0.13 ºC/decade) • More erratic weather (hard to quantify, though) • Species extinctions at an unprecedented rate • Plant growing season and insect cycles are longer
Good references on the subject • http://www.ucsusa.org/global_warming/ • Union of Concerned Scientists • lwf.ncdc.noaa.gov/oa/climate/globalwarming.html • NOAA: the National Oceanic and Atmospheric Admin. • http://epa.gov/climatechange/index.html • Environmental Protection Agency site • Ten myths about global warming • http://www.sierraclub.ca/national/programs/atmosphere-energy/climate-change/ten-myths.html • Field Notes from a Catastrophe, by Elizabeth Kolbert • well-written overview book on climate change • Do the Math: 7. A Recipe for Climate Change 4Q
Reminders • HW 7 due Friday • Quiz 8 also on Friday • Extra Credit (2% of final grade) available on TED • Will do review session during 10th week • exam on Wednesday, 6/12, but I’m out of town after 6/8 • perhaps another session during finals week, led by Matt • Final Exam Study Guide posted