Download
1 / 32
320 likes | 469 Views
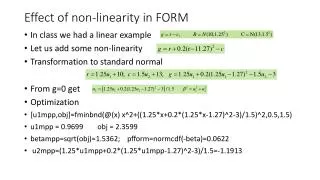
Thresholds, non-linearity and prediction in freshwater ecosystems. Walter K. Dodds Division of Biology Kansas State University. Acknowledgements. Collaborators- Michelle Evans-White, Keith Gido, Jonathon Aguilar, David Chandler, Xiaoying Yang, Don Huggins, Debbie Baker

E N D
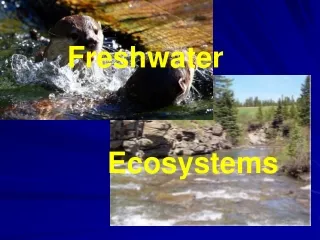
Thresholds, non-linearity and prediction in freshwater ecosystems Walter K. Dodds Division of Biology Kansas State University
Acknowledgements Collaborators- Michelle Evans-White, Keith Gido, Jonathon Aguilar, David Chandler, Xiaoying Yang, Don Huggins, Debbie Baker Funding- NSF EPSCoR Ecological Forecasting, EPA STAR- Thresholds
The talk • Why does it matter? • Defining thresholds and non-linearity • Abiotic patterns • Biotic patterns • Conclusions
Why does it matter? • Many ecological responses are not linear • We are entering a no-analog world that may push us into new areas where we have not been before • Fox. 2007. Science 316:823-825 • Milly et al.2008. Science 319:573-574 • Some thresholds may be very difficult to come back from- total management headaches
Thresholds and non-linearity • Threshold is formally a mathematical concept that is a state change to a new one that is locally stable • Breakpoint is a change in type of functional relationship, but this does not necessarily mean a threshold • Non-linearity can be a breakpoint (more than one function) or take any of many types of functions (e.g. exponential, saturating)
Defining breakpoints and non-linearity • Non-linearity and breakpoints can be defined statistically or empirically • Spatial and temporal scales are important • Understanding thresholds generally requires a mechanistic approach • A practical example- extinction • No statistics necessary • Not a reversible state
Some methods for non-linear and breakpoint characterization • Non-linear regression • Breakpoint regression • Logistic regression/ change point analyses • Two dimensional Kolmogorov-Smirnov (non parametric)
NH4+ uptake by Flathead Lake phytoplankton community V = Vmax* [NH4+ ] (Ks + [NH4+ ])
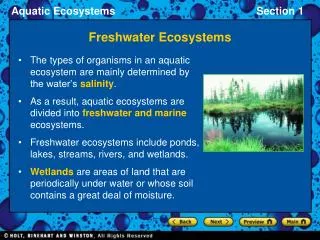
Examples of abiotic patterns • Anoxic hypoxia and reversing eutrophication • Stream flow under the Ogallala Aquifer
Dissociation of iron phosphate FePO4 Fe3++ PO43- Oxic FePO4 PO43- Fe2+ Anoxic
Anoxic Hypoxia • Lakes will be pushed to a eutrophic state if fertilized to the point that oxygen disappears from hypolimnion • Recycling of PO43- from anoxic bottom waters in fall mixing stimulates algal production • Understanding these processes necessary for controlling eutrophication (Carpenter et al. 1999 Ecol. Appl. 9:751-771)
Stream flow andthe Ogallala • Large scale change in hydrology • Driven by agriculture irrigation • Intensified with recent increases in grain prices allowing fuel costs for deep pumping to be offset
Areas in red dropped more than 10 m between 1980 and 1995, in orange 5 m, in yellow 2 m
An example of long-term ecological impacts of humans on the Great Plains
Arikaree River, Kansas(courtesy of KDWP) 1980’s 1996 2006
Threshold? • Streams have entered a new state (dry) • Will they ever recover? • Over thousands of years, yes • Is this a threshold or just a non-linearity? • Depends upon time scale
Biotic examples • Extinction • Nutrients, stoichiometry and aquatic biodiversity • Ecosystem goods and services
Extinctions • 1/3 of European freshwater fish face extinction (IUCN) • 2/5 of North American fishes are imperiled (61 extinct, 280 endangered) Jelks, H.L. Fisheries 33:372-407 • Unionid mussels, same story, substantial extinction debt (Poole, K. E. and J. A. Downing. 2004. JNABS 23:114-125) • We have pushed our freshwaters across a major biological break point and threshold
Nutrients in Midwest streams Macroinvertebrate and nutrient data compiled for Midwest streams
Methodology • Quantify statistical threshold points in richness variation across nutrients using nonparametric changepoint analysis (King & Richardson 2003) • Regression tree analysis • Bootstrap simulation (Efron &Tibshirani 1993) • Cumulative probability of changepoint (5, 50, 95%) • 5% = 5% of the bootstrap simulations resulted in a changepoint < x
Thresholds common with diversity and total phosphorus in water column 5% = 0.040 50% = 0.051 95% = 0.091
Ecosystem goods and servicesA few examples • Possible threshold of watershed area above which sediment input increases drastically • Species area relationships are non-linear • A saturating logarithmic relationship between area and richness • Restoration or conservation of very rare habitat will yield greater increases in diversity values conserved
Fish in lakes Decreasing lake area… from 50 to 10 hectares as opposed to 2-10 hectares
Ecosystem goods and servicesA few more examples Toxins with a minimum toxicity Ecoestrogens that are only active at very low concentrations N saturation of denitrification rates
Conclusions An equilibrium approach is an approximation in a no-analog world Linear models are not universal Several approaches have been taken to identify non-linear conditions and potential breakpoints in relationships
Conclusions- continued • Identification of breakpoints can be important for predicting responses in aquatic environments • Biotic and abiotic systems exhibit breakpoints • Ecosystem goods and services of value to humanity can vary in non-linear ways; there is practical value in considering non-linear responses