
Fluid Cation-Anion Balance Visualization Tool for GSS Analysis
E N D
Presentation Transcript
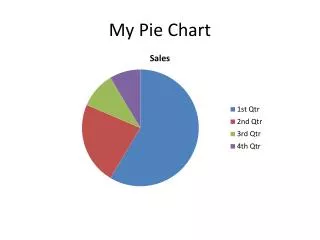
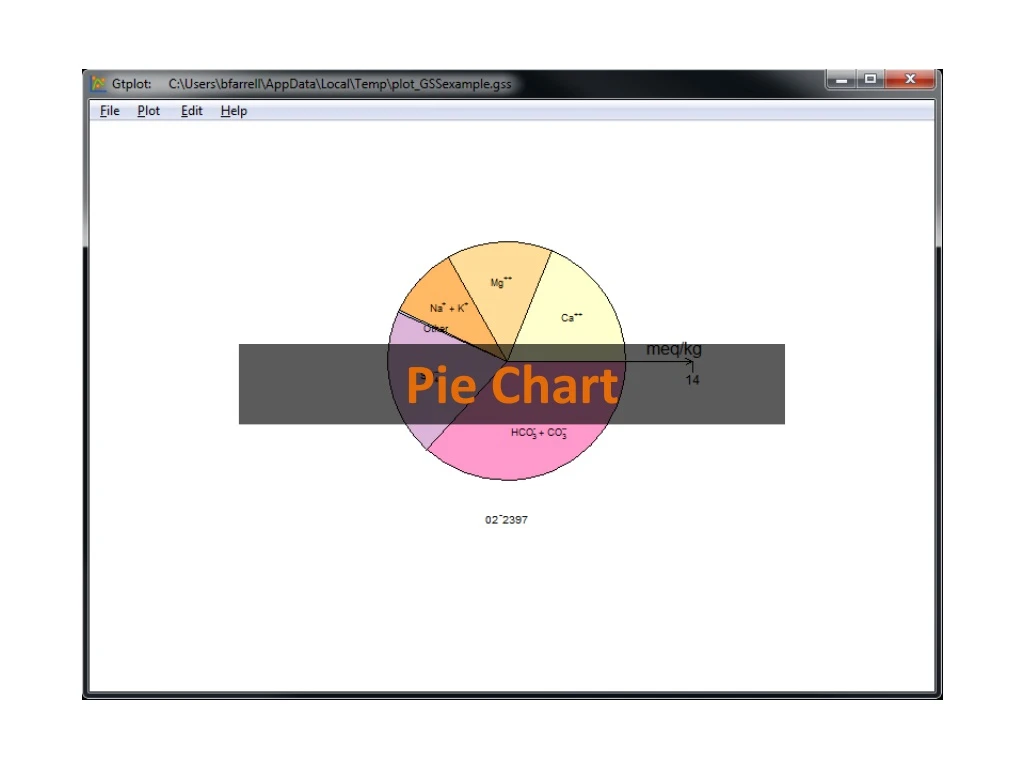
You can launch Gtplot from GSS to create Pie Charts and other specialty plots. Graphs → Pie Chart…
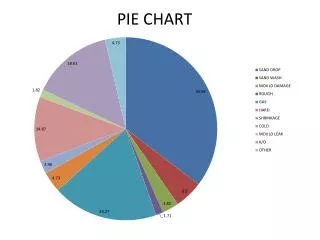
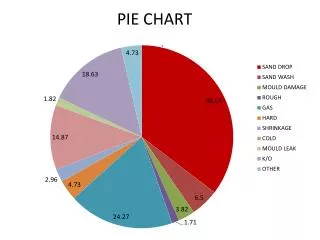
The Pie chart shows the fluid’s cation-anion balance graphically, with the radial direction representing the fluid’s total electrical equivalent content. Right-click on labels or axes to change color, font, size, etc. Double-click on plot to bring up the Pie Chart configuration dialog. Double-click outside the plot to open the View dialog. Toggle sample labels, legend, and more.
Radial direction shows total electrical equivalent content. • You control details of the Pie Chart from the Plot pane. Uncheck “Common ions” and check “Show all labels” to include minor ions.
You can cycle through samples one at a time… • You control which samples are displayed from the Samples pane. Use Block, Next block to cycle through groups of samples. Select the samples to plot.