Download
1 / 19
200 likes | 406 Views
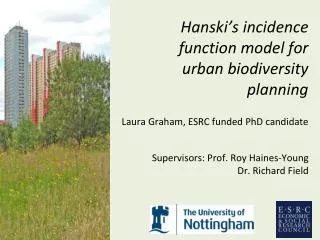
Hanski’s incidence function model for urban biodiversity planning. Laura Graham, ESRC funded PhD candidate. Supervisors: Prof. Roy Haines-Young Dr. Richard Field. Background. Importance of urban ecosystems to both human well-being and biodiversity prevalent in conservation policy

E N D
Hanski’s incidence function model for urban biodiversity planning Laura Graham, ESRC funded PhD candidate Supervisors: Prof. Roy Haines-Young Dr. Richard Field
Background Importance of urban ecosystems to both human well-being and biodiversity prevalent in conservation policy Lawton Report implies a need for conservation planning at a landscape level Does not seem to have formed part of local authority policy
Research Aim To investigate the applicability of the IFM to urban biodiversity planning at landscape scale • by testing suitability of available data through sensitivity analysis To use the IFM to explore policy questions of both local and national relevance
Incidence function model (IFM) Spatially realistic metapopulation model Low data requirements Urban landscapes are fragmented
Incidence function model (IFM) Time (t) = 0
Incidence function model (IFM) Time (t) = 0 t = 1
Incidence function model (IFM) Time (t) = 0 t = 1 t = 2
Incidence function model (IFM) Time (t) = 0 t = 1 t = 2 t = 3
Incidence function model (IFM) Time (t) = 0 t = 1 t = 2 t = 3
Implications of data quality Mis-estimated patch areas Habitat patches not identified False absences in species dataset Moilanen, 2002
Species Data Data from Nottinghamshire Birdwatchers Map shows surveyed grid squares (1998-2011) Data from 1998-2009 grouped into 3 survey windows
Patch Occupancy 1. 2. • Survey data • Interpolated data (kriging) • Random at surveyed % • Random at interpolated % 3. 4.
Blackbird (Turdus merula) ← Effects of occupancy level → ← Effects of spatial structure → Patches Occupied Photo credit: Oystercatcher on flickr Time
Corn Bunting (Miliaria calandra) ← Effects of occupancy level → ← Effects of spatial structure → Patches Occupied Photo credit: Steve Riall on flickr Time
Marsh Tit (Poecile palustris) ← Effects of occupancy level → ← Effects of spatial structure → Patches Occupied Photo credit: Steffen Hannert Time
Parameterise on subset of survey data Parameterise on subsets comprising grid squares surveyed in both 1st and 2nd survey window Run model for each set of parameters
Results of subsetting Patches Occupied Time
Conservation policy implications If IFM has potential to be used to for urban biodiversity planning: • Need for intensive monitoring and surveying • Need for more joined up and centralised databases • Compare relative effects of varying management scenarios