Download
1 / 27
270 likes | 343 Views
Learn about the successful 2005 Winter Storm Reconnaissance Program, its methodologies, and forecast impact on the Blizzard of 2005. Detailed breakdowns and future work are covered.

E N D
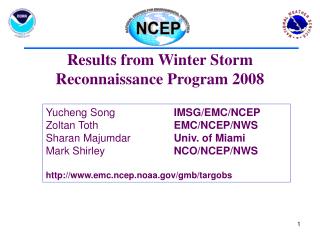
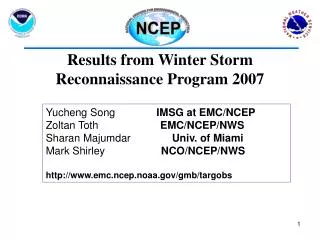
Results from Winter Storm Reconnaissance (WSR) 2005 programs Yucheng Song IMSG at EMC/NCEP Zoltan Toth EMC/NCEP/NWS Sharan Majumdar Univ. of Miami Craig H. Bishop NRL Roy Smith NCO/NCEP/NWS
Acknowledgments • NWS field offices, HPC/NCEP and SDMs • NOAA G-IV and the USAFR C-130 flight crews • CARCAH (John Pavone) • Jack Woollen - EMC • Russ Treadon - EMC • Mark Iredell - EMC • Istvan Szunyogh – Univ. of Maryland • + others who have contributed!
About the Winter Storm Reconnaissance (WSR) Program • Took place 20 Jan – 17 March 2005 • Dropwinsonde observations taken over the NE Pacific by aircraft operated by NOAA’s Aircraft Operations Center (G-IV) and the US Air Force Reserve (C-130s). • Observations are adaptive – • collected only prior to significant winter weather events of interest • in areas that might influence forecast the most. • Operational since January 2001 • 31 flights, around 500 dropsondes this winter which is reduced from 720 drops last year
NOAA G-IV and US Air Force Reserve (C-130s) C-130 G-IV
Evaluation methodology • Compare two parallel runs from NCEP GFS analysis and forecast cycles (T126L28 resolution) • Operational: including all operationally available data (includes dropsondes) • Control: excluding only dropsonde data in the targeted area • Verify against observations over the pre-selected area of interest (verification region) • Rawinsonde observations for surface pressure, 1000-250mb temperature, wind speed and moisture • Rain gauge data for precipitation
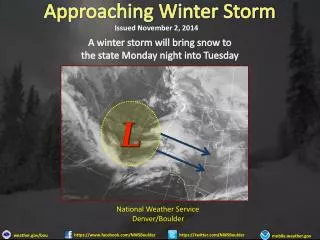
Blizzard of 2005(Jan 22-23,2005) The ETKF spotted the target area
Forecast verification(Jan 22-23,2005) SLP 250mb Height
Results for Surface Pressure Of the cases: 20 improved 1 neutral 9 degraded
Results for Temperature Of the cases: 22 improved 1 neutral 7 degraded
Results for Vector Wind Of all cases: 19 improved 0 neutral 11 degraded
Results for Specific humidity Of all cases: 19 improved 0 neutral 11 degraded
Individual Case Comparison 1 denotes positive effect 0 denotes neutral effect -1 denotes negative effect VR OBSDATE P T V OVERALL REGION FHOUR E 20050120 1 1 1 1 82W ,37N 72 W 20050128 1 1 1 1 123W ,40N 24 C 20050205 1 1 1 1 97W ,31N 36 H 20050206 1 1 1 1 155W ,19.5N 24 C 20050206 1 1 1 1 90W ,43N 72 C 20050207 1 1 1 1 90W ,42N 60 C 20050208 1 -1 1 1 90W ,42N 36 AK 20050208 -1 -1 -1 -1 150W ,61N 48 E 20050208 1 0 -1 0 74W ,43N 48 C 20050209 -1 1 1 1 93W ,35N 96 AK 20050210 -1 -1 1 -1 135W ,55N 24 E 20050212 1 1 1 1 88W ,46N 48 W 20050213 1 1 1 1 123W ,38N 48 W 20050213 1 1 -1 1 123W ,38N 60 W 20050213 1 1 -1 1 123W ,38N 72 AK 20050219 1 1 1 1 150W ,61N 48 W 20050220 -1 1 1 1 118W ,34N 48 W 20050221 1 1 1 1 118W ,34N 24 AK 20050222 -1 -1 -1 -1 138W ,58N 24 AK 20050223 -1 1 1 1 140W ,60N 24 AK 20050225 1 1 1 1 140W ,60N 48 W 20050225 1 1 -1 1 123W ,40N 72 E 20050225 1 1 -1 1 75W ,40N 96 E 20050303 -1 1 1 1 86W ,41N 48 AK 20050309 -1 1 -1 -1 130W ,57N 36 H 20050312 1 -1 -1 -1 157W ,21N 24 E 20050313 0 1 1 1 81W ,32N 96 E 20050314 1 -1 -1 -1 79W ,32N 72 E 20050316 -1 -1 -1 -1 78W ,37N 48 W 20050317 1 1 1 1 122W ,38N 48 22 OVERALL POSITIVE 1 OVERALL NEUTRAL 7 OVERALL NEGATIVE 73% improved 23% degraded OVERALL EFFECT:
Negative Cases Breakdown 1 denotes positive effect 0 denotes neutral effect -1 denotes negative effect VR OBSDATE P T V OVERALL REGION FHOUR AK 20050208 -1 -1 -1 -1 150W ,61N 48 AK 20050210 -1 -1 1 -1 135W ,55N 24 AK 20050222 -1 -1 -1 -1 138W ,58N 24 AK 20050309 -1 1 -1 -1 130W ,57N 36 H 20050312 1 -1 -1 -1 157W ,21N 24 E 20050314 1 -1 -1 -1 79W ,32N 72 E 20050316 -1 -1 -1 -1 78W ,37N 48 • Of all the negative cases – four are for Alaska • One for Hawaii • (as this is only experimental stage) • Two cases for East Coast • It seems that if the signal affecting the verification region is coming from Arctic, forecasts are hard to improve
March 12, 2004 flight P38 – 24 hour verification Hawaii case
Future Work • Examine the effect of dropsondes on precipitation • Improve targeting method based on ETKF method with increasing resolution and ensemble membership • Examine general target areas based on classified verification regions • Improve verification techniques • Increased duration of program for WSR06-07? • Expand program to cover adaptive observation over Gulf of Mexico/Western Atlantic for 12-24 hr Eastern short storm forecast
Background • Preliminary Precipitation verification results • Composite summary maps • ETKF predicted signal propagation
ETS 5mm 10mm CTL 16.35 18.56 OPR 16.50 20.44 Positive vs. negative cases 4:1 3:1 Precipitation verification • Precipitation verification is still in a testing stage due to the lack of station observation data in some regions.
Composite summary maps 139.6W 59.8N 36hrs (7 cases) - 1422km 92W 38.6N 60hrs (5 cases)- 4064km 80W 38.6N 63.5hrs (8 cases) - 5143km 122W 37.5N 49.5hrs (8 cases) - 2034km Verification Region Verification Region
36 hrs (Alaska) 1422km 49.5hrs (West Coast) 2034km 60hrs (Central U.S) 4064km 63.5hrs (East Coast) 5143km The above table listed forecast hours and the distance between the centers of sensitivity and verification regions Forecast hours vs. Distance