Download

1 / 21
210 likes | 342 Views
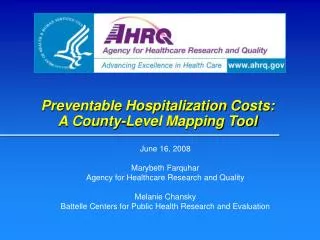
Hands-on Tool Training: Preventable Hospitalization Costs: A County-Level Mapping Tool. State Healthcare Quality Improvement Workshop: Tools You Can Use to Make a Difference December 6-7, 2007 Melanie Chansky Battelle Centers for Public Health Research and Evaluation. System Requirements.

E N D
Hands-on Tool Training: Preventable Hospitalization Costs: A County-Level Mapping Tool State Healthcare Quality Improvement Workshop: Tools You Can Use to Make a Difference December 6-7, 2007 Melanie Chansky Battelle Centers for Public Health Research and Evaluation
System Requirements • Windows version: • Windows NT, XP, 2000, or Vista only • Microsoft .NET framework, v2 or higher • Office 2003 or higher • SAS version: • SAS version 9 or higher • Office 2003 or higher • Not currently available for Macs
QIs Used in the Tool • Version 3.1 Prevention Quality Indicators (14 - all) • Version 3.1 Pediatric Quality Indicators (5 – area level only) • The PHC tool does NOT process any Inpatient Quality Indicators or Patient Safety Indicators
Navigating the Tool The PHC tool is fairly simple and has only 4 screens. Users navigate through these screens to use the tool. The 4 screens are: • Overview • Specify Discharge Dataset • Select QIs to Process • Map Display Options
Screen 1: “Overview” • None of the functions of the tool are accomplished using this screen • Presents a shorter version of what is found in the technical documentation • Available as a resource if needed
Screen 2: “Specify Discharge Dataset” • Allows users to select the hospital discharge data file to be used for analysis • Single state, single year (1995-2007) • Must manually select state and year from drop-down menu • On-screen explanation (also found in technical documentation) explains required file format and variables
Required Variables The following variables must be present in your data file: • Age (patient age in whole years) • Ageday (patient age in days) • Sex (sex coded 1 for male, 2 for female) • DX1 (ICD-9-CM primary diagnosis) • PR1 (ICD-9-CM primary procedure) • MDC (major diagnostic category) • DRG (diagnosis related group) • PSTCO (county of patient residence) • Atype (admission type) • Asource (admission source)
Optional Variables The following variables are optional, but are needed if the user wants the PHC tool to calculate potential cost savings: • Totchg (total charges) • Hospid (State Inpatient Database hospital identifier)
Screen 3: “Select QIs to Process” • Can select any or all available QIs to be processed using the user-supplied dataset • PQIs and PDIs are located on separate tabs • This is the last required screen. Users can submit their data and finish here
Screen 4: “Map Display Options” • Allows users to overlay population information onto maps • Requires a second dataset with variables county, sex, age, and pop • Produces map with stick figures representing the relative size of the population at risk for the selected QI
Outputs • All outputs are automatically placed in the folder where your dataset is located • Outputs include: • CSV file • Excel file • Maps
CSV File • One ASCII CSV dataset is created regardless of how many QIs were selected • The dataset is always called summaries.csv
Excel Files • One Excel file is created for all PQIs selected, another Excel file is created for all PDIs selected • Files are always called PQI or PDI • Each selected PQI/PDI will have its own worksheet named after the specific QI, e.g., PQI14, PQI1, etc. • Contains same data as CSV file, but is easier to read
CSV & Excel Files Include: • Numerator count of flagged cases • Denominator count of the at-risk population • Observed rate • Risk-adjusted rate • Standard error of risk-adjusted rate • Whether county is significantly higher or lower than statewide rate • Potential cost savings associated with a 10% reduction in flagged cases (optional)
Maps • Separate maps will be created for each selected QI • Files will be named after the QI, e.g., PQI14, PQI1 • Can be opened and manipulated using any graphics program or picture viewer
It is recommended that users move and/or rename all output files after running the PHC tool because the automatically-generated file names are not specific and files can easily be overwritten!
Where to Download Download the PHC mapping tool (SAS and Windows versions) and all technical documentation at: http://www.qualityindicators.ahrq.gov/mappingtool.htm
Questions If you have technical questions of any kind while using the PHC tool, contact the QI team at: Support@qualityindicators.ahrq.gov or 1-888-512-6090
My contact information:Melanie Chanskychanskym@battelle.org703-248-1659