Download
1 / 37
370 likes | 518 Views
North of 60 -. A Market Perspective. Matthew L. Janisch P.Eng. Managing Director, BMO Nesbitt Burns. Introduction. The Natural Gas Story - Boom/Bust/? Why the North/Frontier Areas? North vs. Other Opportunities Valuing a Long-term Discovery Risks to Investors Financing the Activity

E N D
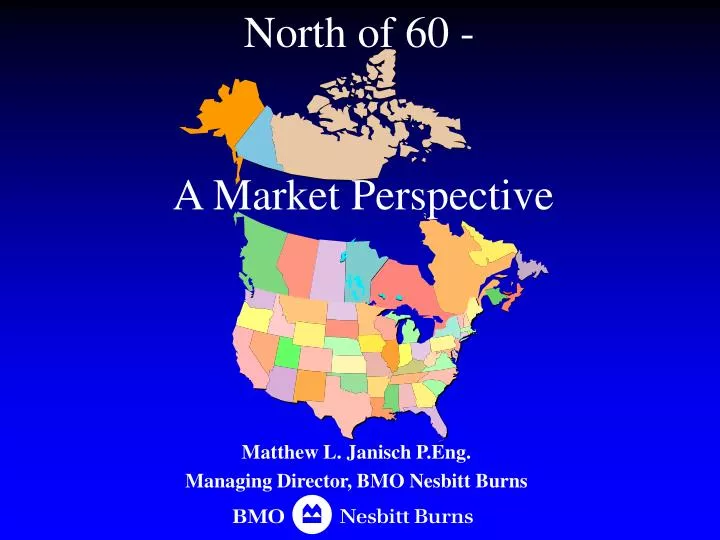
North of 60 - A Market Perspective Matthew L. Janisch P.Eng. Managing Director, BMO Nesbitt Burns
Introduction • The Natural Gas Story - Boom/Bust/? • Why the North/Frontier Areas? • North vs. Other Opportunities • Valuing a Long-term Discovery • Risks to Investors • Financing the Activity • Conclusions
The Natural Gas Story - The Boom Successive warmer than normal winters from 1997/1998 to 1999/2000 masked the trend of growing demand and stagnating supply. Natural gas demand in the U.S. increased 3.4% from 1995 - 2000 and is expected to increase by 53% from 2000 - 2020. Export pipeline expansions have meant Alberta bottleneck was no longer a problem and incremental Canadian supply was expected to help balance the US market - however, up until early 2001, Canadian natural gas supply was below expectations.
The Natural Gas Story - The Boom • Although natural gas drilling was at record levels, the emphasis on shallow, lower productivity wells rather than exploration did not lead to a material supply increase. • The US exited the 2001 heating season with just 627 bcf of natural gas in storage, a record low level. • In the spring of 2001, there was serious concerns about the ability to refill storage to normal levels (in the 3 tcf range), setting the stage for a pro-longed period of high natural gas prices.
The Natural Gas Story - The Bust As at the end of the 2001 heating season, 2,373 bcf of injections were needed to re-fill storage to the 3 tcf level, a record high injection rate. As of November 16, 2,505 bcf had been injected into storage. Storage is now at 3,132 bcf. How did fundamentals change so rapidly? Increased supply from the US and Canada. Reduced demand Reduced industrial demand caused by the economic slow-down Fuel-switching from natural gas to oil during the winter price spike. Concerns about switching back due to expectations for continued high prices and volatility.
The Natural Gas Story • Record natural gas drilling in 2000 and 2001. Expected to decline in 2002 with lower prices.
The Natural Gas Story • The Canadian supply response began to show up in April and year-over-year production is approximately 1.2 bcf/d higher. Approximately 0.5 bcf/d of this increase is from the Ladyfern natural gas discovery. Sustainability of these production additions remain questionable.
The Natural Gas Story • US production increased approximately 3.3% y/y in Q3/01. As with Canada, sustainability remains an issue - sequential quarterly growth appears negligible.
The Natural Gas Story • US storage is now at 3,132 bcf, 18% above last year’s level.
The Natural Gas Story • Exiting the heating season with 3,132 bcf, even with the largest seasonal withdrawal over the last 5 years would still leave 1,111 bcf of gas in storage, well above historical levels.
The Natural Gas Story • Result: Boom and Bust.
The Natural Gas Story - 2003 - 2005 • Our outlook for weakening oil and natural gas prices in 2002 will mean reduced drilling budgets. • High natural declines on virtually all North American gas production could mean that supply begins to decline in 2002. • Economic recovery in late 2002 will increase demand for gas. • Result: Mid-term natural gas prices (2003-2005) should exceed historical levels. • Note: volatility will continue as the market remains extremely sensitive to seemingly small changes in supply/demand fundamentals.
Why the North/Frontier Areas? • Opportunities to grow conventional natural gas production in North America are more limited for large companies. • New pool sizes are decreasing • Average initial productivity per well is decreasing • Decline rates are increasing • Costs are increasing
Why the North/Frontier Areas? • It continues to be difficult for companies to replace production organically, resulting in a declining North American gas reserve base.
Why the North/Frontier Areas? • Discovery sizes are shrinking, the Alberta example: Average Alberta Gas Pool Size Bcf 7 6 5 4 Marketable Reserves 3 2 1 0 1970-1979 1980-1989 1990-1999
Why the North/Frontier Areas? • Reserve replacement costs on conventional reserves are increasing rapidly.
Why the North/Frontier Areas? • Average well productivity is declining in the U.S. Natural Gas Producing Wells vs. Producing Wells Average Productivity 350 165 160 300 Producing Gas Wells, Thousands 155 Producing Wells Average Productivity, bcf/d 150 250 Natural Gas Producing Well, 145 Thousands Producing Wells Average Productivity (bcf/d) 200 140 1990 1991 1992 1993 1994 1995 1996 1997 1998 1999 2000 Source: EIA
Why the North/Frontier Areas? Average Initial Well Productivity by Connection Year thousand m3/d MMcf/d 30 25 20 15 10 5 0 1.0 0.8 0.6 0.4 0.2 0.0 1990 1991 1992 1993 1994 1995 1996 1997 1998 1999 Source: NEB Short-term Natural Gas Deliverability from the WCSB - December 2000 • Initial productivity per well is decreasing in Western Canada
Why the North/Frontier Areas? • US decline rates are increasing Average Decline Rates in the United States 50% 40% 30% Percent per year 20% 10% Shallow Water Onshore Gulf Midcontinent 0% 1995 1996 1997 1998 1999 2000 2001 Source: PIRA
Why the North/Frontier Areas? WCSB Average Decline Rates by Connection Year percent per year 50 40 30 20 10 0 First Decline Second Decline 1990 1991 1992 1993 1994 1995 1996 1997 1998 1999 Source: NEB Short-term Natural Gas Deliverability from the WCSB - December 2000 • Decline rates in Western Canada are also increasing
Why the North/Frontier Areas? WCSB Marketable Gas Production by Connection Year million m3/d Bcf/d 500 16 14 400 12 300 10 8 200 6 Pre-1990 4 100 2 1/90 1/91 1/92 1/93 1/94 1/95 1/96 1/97 1/98 1/99 Source: NEB Short-term Natural Gas Deliverability from the WCSB - December 2000 • Decline rates in Western Canada are also increasing
Why the North/Frontier Areas? • Lower growth opportunities and significant competition mean that large companies need to look beyond conventional basins for growth. • U.S. demand for natural gas is expected to increase dramatically over the next several years. The EIA estimates natural gas consumption to increase by 23% by 2010 from 2000 levels. • Incremental demand for natural gas from Alberta oil sands/heavy oil projects could be over 1 bcf/d by 2010. • North Slope natural gas would lead to a reduction of United States reliance on other countries to supply their energy needs. • Larger international companies have been de-emphasizing North America conventional for a number of years.
North vs. Other Opportunities • Western Canada (Tcf): UR 30 UCR 1 ER 7 CP 12 Total 50 UR 138 UCR 8 ER 38 CP 66 Total 270 UR 2 UCR 8 ER 3 CP 4 Total 9 UR Undiscovered Reserves UCR Unconnected Reserves ER Established Reserves CP Cumulative Production Source: NEB, Canadian Energy: Supply & Demand to 2025
North vs. Other Opportunities • Proved (Established) Reserves in the United States (Tcf): • Lower 48 Total: 157.4 Tcf • Assessed additional conventional resources of 938 Tcf. 2.94 .84 .42 .22 2.24 14.23 1.77 1.18 3.21 2.01 8.99 5.75 1.44 2.27 12.54 15.45 1.54 Offshore California: .54 4.29 .68 40.16 9.24 Offshore Gulf of Mexico: 25.45 Source: Natural Gas Statistics - EIA and U.S. Department of Energy.
North vs. Other Opportunities Arctic Islands UR 80 UCR 14 Total 94 • Outside the WCSB (Tcf): Yukon UR 10 UCR 1 Total 11 Grand Banks / Labrador UR 36 UCR 9 Total 45 Mackenzie/Beaufort UR 55 UCR 9 Total 64 Scotia Shelf UR 13 UCR 2 Total* 18 Source: NEB, Supply & Demand to 2025 * Includes ER of 3.0 and CP of 0.3
North vs. Other Opportunities • Beyond the Lower 48 (Tcf): • Alaskan Department of Natural Resources state natural gas reserves in the North Slope total at least 31 tcf. 9.73 Source: Natural Gas Statistics - EIA
North vs. Other Opportunities • The following table summarizes the reserve scenario for different regions of North America:
Canadian North vs. Other Opportunities • Although the Canadian North and Alaska are highly touted, there are other potential supply alternatives such as: • Liquefied Natural Gas (LNG) - Plans have been tabled that could increase LNG imports into the U.S. to 2.2 bcf/d by 2020, representing 2.7% of supply. With a higher price scenario, LNG could end up being 10% of U.S. supply. • If these plans were developed before Northern gas, it may eliminate or defer the need for an expensive pipeline. However, safety is still a perceived issue for LNG. • Coal Bed Methane (CBM) - The United States has 13.2 tcf of CBM reserves. A number of pilot projects are underway in Canada testing the economic feasibility of CBM. Should the process work, a huge resource base closer to existing infrastructure would be opened up that could eliminate or defer the need for an expensive pipeline.
Market Valuation of Long-Term Projects • No specific way to value a long-term project but usually is a combination of quantitative and qualitative considerations: • Quantitative: • Calculate the net present value of the project - i.e. in today’s dollars, how much is this project worth considering the cost to develop it? • In a truly efficient market, the share price would increase by the calculated present value of the discovery. However, the market is not 100% efficient and net asset value depends on many critical assumptions.
Quantitative Considerations - A PV Example • As an example, consider a producer with the following announcement: • 1 Tcf of estimated natural gas reserves • Estimated to be on-stream in 6 years • Approximately US$1 billion in capital investment is required • How much is this discovery worth today? Firm's Weighted Average Cost of Capital 6% 7% 8% 9% 10% 2 $358 $336 $316 $296 $276 4 $297 $269 $243 $218 $194 Years Until 6 $264 $235 $208 $183 $161 Production $205 8 $235 $178 $154 $133 $179 10 $153 $130 $110 $209 Assumption: 1 mcf = US$1.50/mcf in the ground at the date of first production
Qualitative Considerations • Although there may be little present value to a long-term discovery, there are qualitative benefits: • Strategic - Does this initial discovery give the company a competitive advantage? i.e. a discovery may allow the company to tie up significant tracts of land. • Growth Visibility: The market typically favors companies with easily definable growth. • Qualitative benefits are usually reflected in the company’s share price through the application of a higher earnings or cash flow multiples.
Risks To Investors • Stranded capital - after significant exploration investment either nothing is discovered or no infrastructure is built to tie-in discoveries. • Alternative sources of natural gas supply quicker to come on stream - successful economic development of Coal Bed Methane (CBM) in western Canada or increased production in the United States, would open up a vast resource base, eliminating the need for Northern gas over the mid term. • Increased popularity of LNG to service the U.S. • What happens to natural gas prices upon completion of new pipeline which delivers 2.0 - 6.0 bcf/d of gas into the market?
Risks To Investors • Potential for Mexico to become a net exporter over the next 5-7 years? • Political interference could be detrimental to any Northern gas project. • Opposition to project - i.e. land claims, aboriginal issues. • Cost overruns? Based on previous mega-projects, cost-overruns should not be unexpected. • Drilling costs. Due to limited rig availability in the north, do the development costs outweigh the benefits?
Lessons from the past • Nothing is guaranteed - Many companies have had reserves in the far north since the ‘70s. Plans to build a pipeline were far advanced and were later mothballed due to declining prices. • Unsettled land claims were at least partially responsible for stalling the last project. We are again seeing a small but steady increase to the number of native issues arising which could stall the project, especially in the Yukon Territory.
Conclusion • Far north exploration and development has exciting potential but is only one area for potential production growth. Companies should not count on this area alone for growth. • Discoveries in the far north may have little fundamental value but investors may still pay for some of the qualitative benefits. • There are still significant risks/problems that stand in the way of northern development.
Leverage to the North Alberta Energy Anadarko BP/BP Canada Burlington Canadian Natural Resources Chevron Conoco Devon Exxon Mobil Forest Oil Imperial Murphy Oil PanCanadian Petro-Canada Phillips Petroleum Shell Canada The following companies have the leverage to the north:
North of 60 - A Market Perspective Matthew L. Janisch P.Eng. Managing Director, BMO Nesbitt Burns