Download

1 / 16
160 likes | 244 Views
Explore the evolution of urban hubs with the 2012 update on Activity Centers, highlighting increased centers, mixed-use developments, improved transportation infrastructure alignment, and key applications. Learn about core attributes, additional criteria, and strategic investment plans for Maryland, Virginia, and the District of Columbia. Stay informed on upcoming presentations and the approval schedule by the COG Board. Contact Sophie Mintier for more information at smintier@mwcog.org or (202) 962-3753.

E N D
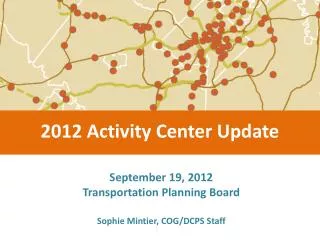
2012 Activity Center Update September 19, 2012 Transportation Planning Board Sophie Mintier, COG/DCPS Staff
Activity Centers – Past • Based on Cooperative Forecasting Results • First map released in 2002; minor update in 2007 2002 – 58 centers 2007 – 59 centers
Activity Centers - Now • Selected using new approach • Major changes for 2012 update • 136 centers
Attribute Menu to Identify Activity Centers
Core Attributes (both required) • Policy: Designated as a center or priority growth area in locally-adopted land use plan • Density: By 2040, has a persons per acre density (employment + population) within top half of densities in the jurisdiction
Additional Attributes (any 2 required) • Intersection Density: At least 55 intersections/square mile • Transit Capacity: Existing high-capacity transit, planned transit in CLRP, or planned transit with local funding • Land Use Mix: Mixed-use development designation in land use plan/zoning ordinance • Housing & Transportation Affordability: Combined housing • & transportation costs don’t exceed 45% of regional median income
Key Changes/Outcomes • Involved Local Planning Departments in Center Selection • Worked one-on-one with every jurisdiction • Aligned with Local Planning • Picks up places local governments have designated as significant • Most Centers are Mixed-Use • Shift from primarily employment-focused centers to majority mixed-use centers
Key Changes/Outcomes • More, but Smaller Centers • 2007 Centers: 59 • 2012 Centers: 136 – occupy less total land area than previous centers • Most fall within old center boundaries • Better scale for implementation
Key Changes/Outcomes • More Aligned with Major Transportation Infrastructure • Many additional rail stations included in centers • 67% of 2012 centers served by rail transit by 2040 • (vs. 50% of 2007 centers)
Key Applications How Activity Centers will be used • Technical: • Growth forecasts • Transportation modeling • Demographic analysis • Policy: • Priority growth areas • Monitor progress on Region Forward • Inform planning, development, grantmaking activities • Prioritize locations for investment – e.g. Activity Center Strategic Investment Plan, Transportation Priorities Plan
Next Steps • September - October: • Present centers at city/county Council & Board work sessions • Develop Activity Center technical boundaries • Launch Activity Center implementation work: Strategic Investment Plan • November: • COG Board approval of Activity Centers
Outreach Schedule Council & Board work sessions • Upcoming: • Today: City of Frederick • 9/25: City of Fairfax • 10/1: Rockville • 10/2: Fairfax Co. • 10/2: Manassas Park • 10/3: Loudoun Co. • 10/9: District of Columbia • 10 /15: Falls Church • 10/16: Arlington • 10/16: College Park • 10/23: Prince George’s Co. • 10/29: Gaithersburg • Done: • Manassas • Takoma Park • Greenbelt • Montgomery Co. • Alexandria • Frederick Co. • Charles Co. • Bowie
2012 Activity Center Update September 19, 2012 Transportation Planning Board Sophie Mintier, COG/DCPS Staff smintier@mwcog.org (202)962-3753