Multidimensional Optimality of Microbial Metabolism
220 likes | 356 Views
This study examines the complex metabolic network of Escherichia coli, focusing on its optimality within multidimensional space. By utilizing C-based flux analysis, the authors explore how metabolic pathways function and adapt under varying environmental conditions. The research highlights the Pareto optimality of metabolic reactions, revealing the balance between biomass yield and energy efficiency. Findings indicate that E. coli operates near the Pareto surface, suggesting a strategy to minimize flux adjustments across different environments. This has implications for understanding metabolic resilience in microorganisms.

Multidimensional Optimality of Microbial Metabolism
E N D
Presentation Transcript
Multidimensional Optimality ofMicrobial Metabolism Robert Schuetz, Nicola Zamboni, MattiaZampieri, Matthias Heinemann, Uwe Sauer Science 4 May 2012: Vol. 336 no. 6081 pp. 601-604 黃信博 廖堃吉 張至安 林建棋 郭明宏
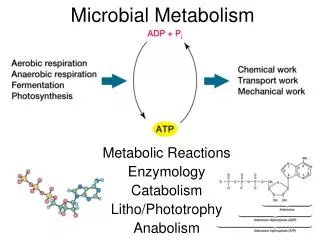
Metabolic network • Metabolic pathways • Series ofchemical reactions occurring within a cell. • Metabolic network • The complete set of metabolic and physical processes that determine the physiological and biochemical properties of a cell. 有氧呼吸 (metabolic pathway) C6H12O6(水溶液) + 6 O2(氣態) → 6 CO2(氣態) + 6 H2O(液態)
C-based flux analysis • Many properties of complex networks cannot be understood from monitoring the components • The functional behavior of a network emerges only through the nonlinear gene, protein, and metabolite interactions across multiple metabolic and regulatory layers.
C-based flux analysis-2 • Intracellular reaction rates are the functional end points of these interactions. • Minimization of the redox potential (i.e. minimization of all fluxes that produce NADH, NADPH or FADH2) • intracellular reaction rates cannot be detected directly, but must be estimated through computer model-based interpretation of stable isotope patterns in products of metabolism.
Stoichiometric Reaction Model • A stoichiometric model of metabolism was developed to describe the balance of metabolic reactions during steady-state growth of Escherichia coli on glucose (or metabolic intermediates) and mineral salts • The model incorporates 153 reversible and 147 irreversible reactions
Pareto Optimal Solution • The term is named after Vilfredo Pareto (1848–1923), an Italian economist • Deal with Multi-objective optimization problem. • A Pareto optimal outcome is one such that no-one could be made better off without making someone else worse off.
Fig. 1 (A) Projection of 44 13C-determined in vivo flux distributions of E. coli wild type into the solution space defined by three objectives. The Pareto surface is shown in red. Blue dots indicate cultures for which glucose was present in excess. Axes values are normalized such that the coordinates of the points on the Pareto surface range from 0 to 1, where 1 represents the theoretical minimum or maximum of an objective. (B to E) Pareto surface distance of the 44 13C-determined (solid bars) and 10,000 random flux distributions (open bars) that are uniformly distributed within the full solution space (26).
Random fluxes were chosen without imposing additional constraints (B), after elimination of futile cycles (C) and upon additionally constraining the biomass yield to at least 20% of the maximal theoretical value (D). The solid black line highlights the subspace of metabolic optimality that is relevant in vivo with a maximal distance of 0.025 units from the Pareto surface (E). Data were binned to reduce noise. The distance for the anaerobic condition is relative to its respective Pareto surface. The red bars in (B) represent the flux distribution of the E. coli triple mutant with deleted pyruvate formatelyase (pfl), lactate dehydrogenase (ldhA), and glucose phosphotransferase system enzyme II (ptsG) at CO2 concentrations of 3, 10, and 50% (27).
Other 8 bacteria • other bacterial species also locate close to the surface • different locations on the surface indicate that each species features a distinct flux distribution under a given condition. • metabolism of wild-type bacteria appears to generally operate close to the Pareto surface of the space that defines metabolic optimality as a combination of (i) network output in the form of biomass and energy yield and (ii) resource allocation.
determined the values that each reaction flux can assume in the subspace immediately below the spot on the Pareto surface • For each of the 18 degrees of freedom,calculated (by exhaustive sampling) the absolute range of fluxes
All experimentally determined flux distributionscharacterized by a significant variability • for example, in aerobic batch cultures the glucose-6-phosphate dehydrogenase (Zwf) flux locates at a distance where the flux can vary from 3 to 11 mmol/g per hour at the same optimality value (Fig. 3A). • Variability = standard deviation/mean value
aerobic (black) • anaerobic (green) glucose batch cultures • glucose-limited continuous cultures with D = 0.09 1/hour (red) • 0.4 1/hour (light blue) • nitrogen-limited continuous cultures with D = 0.4 1/hour (dark yellow)
A specific flux distribution at a certain condition might be chosen to minimize adjustment efforts to other conditions • To test this possibility, they systematically computed the average flux adjustments
Average flux adjustment between multiple environmental conditions. • E. coli operates its metabolism slightly below the Pareto surface. • A specific flux distribution at a certain condition might be chosen to minimize adjustment efforts to other conditions. • Compute the average flux adjustments that would be required to switch between the five investigated environmental conditions
Conclusion • Near-optimal metabolism and minimal flux adjustment suffice to explain all investigated flux distributions • Minimal flux adjustment represent an optimal starting point. • Provide a consistent theoretical framework to decipher optimality-based forces.