Download
1 / 42
420 likes | 532 Views
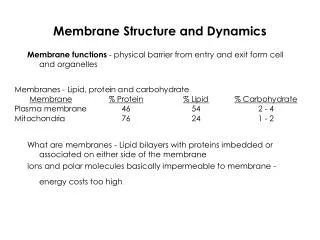
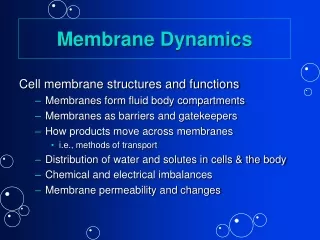
Membrane Dynamics. 5. Mass Balance in the Body. To maintian a constant amount of substance in the body any amount gain must be equal to that lost. Figure 5-2. Mass Balance and Homeostasis. Clearance

E N D
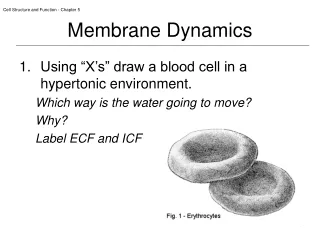
Mass Balance in the Body To maintian a constant amount of substance in the body any amount gain must be equal to that lost. Figure 5-2
Mass Balance and Homeostasis • Clearance • Rate at which a molecule disappears from the body - excretion occurs in the form of urine, feces, lungs, or integument and metabolism which uses substances as substrates and creates metabolites(liver & kidneys). • Mass flow = concentration volume flow (amount X/min) (amountX/vol) (vol/min) • Also takes into account the movement through compartments and whether it crosses the membrane • Homeostasis equilibrium – the chemical compositions in the ECF and ICF are not at equilibrium but each is maintained at a constant state • Osmotic equilibrium- water is the only substance that reaches it • Chemical disequilibrium- greater concentration in one compartmemt • Electrical disequilibrium- inside of cells is slightly more negative
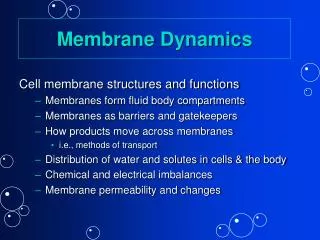
Homeostasis Distribution of solutes in the body fluid compartments • The compartments in the body are in a state of chemical dynamic disequilibrium- no net movement of materials Figure 5-3a
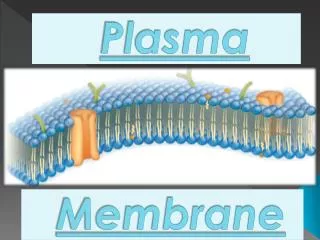
Homeostasis Selective permeability of the plasma membrane helps to maintian disequilibrium at constant [solute] Figure 5-3b
Diffusion Map of membrane transport The size of a molecule and its lipid solubility determine how it will cross the memebrane. Membranes are selectively permeable Figure 5-4
Diffusion: Seven Proprieties • Passive process- does not require energy input but used the kinetic energy in the molecules • High concentration to low concentration- direction of molecule movement along a concentration gradient • Net movement until concentration is equal- diffusion will continue across non-living mediums until dynamic equilibrium is reached • Rapid over short distances- diffusion is proportional to the square of the distance between two points. In living systems transport mechanisms compensate for delays • Directly related to temperature- directly proportional to temperature changes • Inversely related to molecular size- the smaller the radius, the lower the friction, the faster the movement across a medium • In open system or across a partition- diffusion is limited by the permeability of the barrier.
A hypertonic solution • Has a higher concentration of solute • A hypotonic solution • Has a lower concentration of solute • An isotonic solution • Has an equal concentration of solute
Molecules of dye Membrane Equilibrium (a) Passive transport of one type of molecule Equilibrium (b) Passive transport of two types of molecules Molecules still move across the membrane once equilibrium is reached, but the movement is simultaneously equal in both directions. Figure 5.11
Simple Diffusion Fick’s law of diffusion – takes into account the various components that influence simple diffusion Figure 5-6
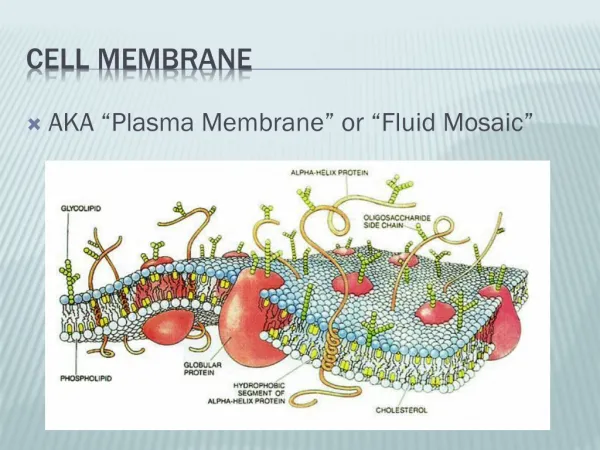
Membrane Proteins Function • Structural proteins – forms cytoskeleton, cell junctions, and link cells to EC matrix • Enzymes – carry out reactions just outside or inside the cell and transfer signals • Membrane receptor proteins – play a role in signaling by activating a response when a ligand binds, also involved in vesicle transport. • Transporters – move molecules across membranes • Channel proteins – directly link ECF and ICF by having a fluid filled compartment, open at both ends • Carrier proteins – not open at both ends, bind ligand but don’t have a fluid continum
Membrane Transport Proteins Water channels and ion channels are examples of open channels. Carriers are proteins that change shape as they transport molecules across the membrane. They may carry one or more molecules at a time. Figure 5-9a
Types of Carrier-Mediated Transport Substrate specific for ions or molecules too large for channel proteins Figure 5-12a
Types of Carrier-Mediated Transport Carrier proteins never create a continuous passageway. Movement through carriers is slower than through protein channels because of the conformation change. Figure 5-12c
Gating of Channel Proteins Gated channels are either chemically, mechanically, or voltage-gated. We will learn more about gated channel during nervous and muscular system Figure 5-11
Types of Carrier-Mediated Transport • Gates control the direction of flow from either end via conformational changes
Facilitated Diffusion Diffusion of glucose into cell • How is the concentration gradient maintained for glucose? Helps to keep it from building up or leaving the cell. Figure 5-15
Primary Active Transport ECF 1 ATP ADP 5 2 3 Na+ from ICF bind ICF P ATPase is phosphorylated with Pi from ATP. 2 K+ released into ICF Protein changes conformation. Protein changes conformation. P 3 K+ released into ICF 4 3 2 K+ from ECF bind P P Mechanism of the Na+-K+-ATPase ATP is used as an energy source Figure 5-17
Primary Active Transport ECF 1 ATP ADP 2 3 Na+ from ICF bind ICF P ATPase is phosphorylated with Pi from ATP. ATP is hydrolyzed into ADP to release the energy ATP is a molecule used for energy during cellular reactions. The energy obtained from nutrient molecules is stored in ATP during cellular respiration Figure 5-17, steps 1–2
Primary Active Transport ECF 1 ATP ADP 2 3 Na+ from ICF bind ICF P ATPase is phosphorylated with Pi from ATP. Protein changes conformation. 3 Na+ released into ICF 3 P Three sodium ions bind, pump gets energyzed, conformation change occurs,sodium is released. Figure 5-17, steps 1–3
Primary Active Transport ECF 1 ATP ADP 2 3 Na+ from ICF bind ICF P ATPase is phosphorylated with Pi from ATP. Protein changes conformation. 3 K+ released into ICF 4 3 2 K+ from ECF bind P P The conformation allows two potassium ions to bind and the dephosphorylation changes the conformation again allowing the ions into the cell Figure 5-17, steps 1–4
Primary Active Transport ECF 1 ATP ADP 5 2 3 Na+ from ICF bind ICF P ATPase is phosphorylated with Pi from ATP. 2 K+ released into ICF Protein changes conformation. Protein changes conformation. P 3 K+ released into ICF 4 3 2 K+ from ECF bind P P Figure 5-17, steps 1–5
Secondary Active Transport 1 Na+ binds to carrier. 3 Glucose binding changes carrier conformation. Intracellular fluid Lumen of intestine or kidney Na+ Na+ SGLT protein Glu Glu [Na+] high [Glucose] low [Na+] low [Glucose] high Na+ released into cytosol. Glucose follows. 4 2 Na+ binding creates a site for glucose. Na+ Na+ Glu Glu Mechanism of the SGLT Transporter- uses potential energy of the concentration gradient created by primary active transport which used ATP directly. Figure 5-18
Secondary Active Transport 1 Na+ binds to carrier. Intracellular fluid Lumen of intestine or kidney Na+ SGLT protein Glu [Na+] high [Glucose] low [Na+] low [Glucose] high Active transport allowd for a greater Na concentration in the ECF and lower in the ICF. Na will move along the gradient Figure 5-18, step 1
Secondary Active Transport 1 Na+ binds to carrier. Intracellular fluid Lumen of intestine or kidney Na+ SGLT protein Glu [Na+] high [Glucose] low [Na+] low [Glucose] high 2 Na+ binding creates a site for glucose. Na+ Glu Glucose will be able to bind after Na binds and the carrier will take it against its concentration gradient Figure 5-18, steps 1–2
Secondary Active Transport 1 Na+ binds to carrier. 3 Glucose binding changes carrier conformation. Intracellular fluid Lumen of intestine or kidney Na+ Na+ SGLT protein Glu Glu [Na+] high [Glucose] low [Na+] low [Glucose] high 2 Na+ binding creates a site for glucose. Na+ Glu • Uses the energy of one molecule moving down its concentration gradient in symport or antiport Figure 5-18, steps 1–3
Secondary Active Transport 1 Na+ binds to carrier. 3 Glucose binding changes carrier conformation. Intracellular fluid Lumen of intestine or kidney Na+ Na+ SGLT protein Glu Glu [Na+] high [Glucose] low [Na+] low [Glucose] high Na+ released into cytosol. Glucose follows. 4 2 Na+ binding creates a site for glucose. Na+ Na+ Glu Glu The cotransported molecules may be ions or uncharged molecules. Figure 5-18, steps 1–4
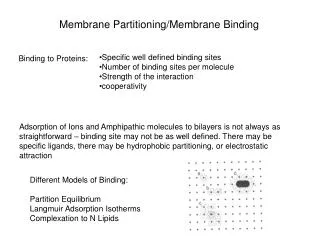
Carrier-Mediated Transport • Specificity – moves only one molecule or different closely related molecules • Competition – due to a difference of affinity for molecules that are closely related, there are competitive inhibitors that block the binding and not moved across the cell • Saturation – like enzymes as [substrate] so does rate • Transport maximum – a point when all carrier binding sites are full- limits rate
Vesicular Transport • Phagocytosis • Cell engulfs bacterium or other particle into phagosome- a large vesicle; requires ATP for cytoskeleton movement • Endocytosis • Membrane surface indents and forms vesicles- different process than phagocytosis • Active process which can be nonselective (pinocytosis) or highly selective • Potocytosis uses caveolae (“little caves”)- lipid anchored proteins that bind ligands to concentrate then, transport across epithelium, or cell signaling. • Receptor-mediated uses clathrin-coated pits- very specific
Receptor-Mediated Endocytosis and Exocytosis 1 Extracellular fluid Ligand binds to membrane receptor. 9 Exocytosis Receptor-ligand migrates to clathrin-coated pit. 2 8 Transport vesicle and cell membrane fuse (membrane recycling). Clathrin- coated pit 3 Endocytosis Receptor Clathrin Transport vesicle with receptors moves to the cell membrane. 7 4 Vesicle loses clathrin coat. 4 Receptors and ligands separate. 5 To lysosome or Golgi complex Intracellular fluid 6 Ligands go to lysosomes or Golgi for processing. Endosome A very specific form of endocytosis. Receptors bring in molecules such as cholesterol Figure 5-24
Transepithelial Transport Polarized cells of transporting epithelia -combine active and passive transport -use different transporter types at the apical and basolateral sides Figure 5-25
Transepithelial Transport of Glucose 1 Na+ glucose symporter brings glucose into cell against its gradient using energy stored in the Na+ concentration gradient. Glu [Glucose] low Na+ [Na+] high Lumen of kidney or intestine 1 2 GLUT transporter transfers glucose to ECF by facilitated diffusion. Apical membrane Glu Na+ [Na+] low [Glucose] high 3 Na+ -K+- ATPase pumps Na+ out of the cell, keeping ICF Na+ concentration low. Epithelial cell Basolateral membrane Glu Na+ K+ 2 3 ATP Extracellular fluid Glu [Glucose] low [Na+] high Na+ K+ Figure 5-26, steps 1–3
Transcytosis across the Capillary Endothelium Figure 5-27
The Body Is Mostly Water Distribution of water volume in the three body fluid compartments Figure 5-28
Osmosis and Osmotic Pressure Osmolarity describes the number of particles in solution Figure 5-29
Osmolarity: Comparing Solutions • Solution A = 1 OsM Glucose • Solution B = 2 OsM Glucose • B is hyperosmotic to A • A is hyposmotic to B • What would be the osmolarity of a solution which is isosmotic to A? to B?
Tonicity Tonicity describes the volume change of a cell placed in a solution
Tonicity Tonicity depends on the relative concentrations of nonpenetrating solutes Figure 5-30a
Tonicity Tonicity depends on nonpenetrating solutes only Figure 5-30b
Water Balance in Animal Cells • The survival of a cell depends on its ability to balance water uptake and loss • Osmoregulation is the control of water balance in animals Animal cell Normal Lysing Shriveled Plasma membrane Plant cell Shriveled Flaccid (wilts) Turgid (b) Hypotonic solution (a) Isotonic solution (c) Hypertonic solution Figure 5.13