Download
1 / 17
170 likes | 292 Views
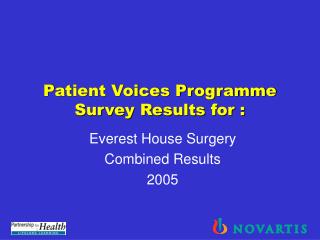
Patient Voices Programme Survey Results for :. Everest House Surgery Combined Results 2005. Introduction. The following slides show the results of the Patient Voices Programme audit that your practice has recently completed The results shown are the mean figures

E N D
Patient Voices ProgrammeSurvey Results for : Everest House Surgery Combined Results 2005
Introduction • The following slides show the results of the Patient Voices Programme audit that your practice has recently completed • The results shown are the mean figures • To view the frequency breakdown of the results, please see the written report provided with this slide set
100 90 75 75 80 73 68 70 64 64 62 58 60 50 Percentage of responses 40 30 20 10 0 Q2. Satisfaction with Q3a. Satisfaction with opening Q4b. Satisfaction with Q5b. Satisfaction with receptionists hours availability of particular doctor availability of any doctor Mean score GPAQ benchmark Evaluation of questions 2–5b (as percentages) compared to the GPAQ benchmarks
90 80 72 72 70 62 60 58 55 60 52 49 50 Percentage of responses 40 30 20 10 0 Q7b. Satisfaction with waiting Q8a. Satisfaction with Q8b. Satisfaction with phoning Q9b. Satisfaction with times at practice phoning through to practice through to doctor for advice continuity of care Mean score GPAQ benchmark Evaluation of questions 7b–9b (as percentages) compared to the GPAQ benchmarks
100 85 84 90 82 82 79 78 76 75 80 70 60 50 Percentage of responses 40 30 20 10 0 Q10a. Satisfaction with Q10b. Satisfaction with Q10c. Satisfaction with how Q10d. Satisfaction with how doctor's questioning how well doctor listens well doctor puts patient at much doctor involves patient ease Mean score GPAQ benchmark Evaluation of questions 10a–10d (as percentages) compared to the GPAQ benchmarks
100 85 85 84 90 81 78 78 78 80 73 70 60 50 Percentage of responses 40 30 20 10 0 Q10e. Satisfaction with Q10f. Satisfaction with time Q10g. Satisfaction with Q10h. Satisfaction with doctor's explanations doctor spends doctor's patience doctor's caring and concern Mean score GPAQ benchmark Evaluation of questions 10e–10h (as percentages) compared to the GPAQ benchmarks
100 90 81 79 78 78 78 77 76 76 80 70 60 50 Percentage of responses 40 30 20 10 0 Q12a. How well nurse listens Q12b. Quality of care Q12c. How well nurse explain Q13. Overall satisfaction with to what you say nurse provides problems/treatments practice Mean score GPAQ benchmark Evaluation of questions 12a–13 (as percentages) compared to the GPAQ benchmarks
Q3b. What additional hours would you like the practice to be open? Mornings Lunchtime Evenings Weekends None
180 169 151 160 140 120 103 103 96 89 100 86 80 Number of responses 53 52 60 40 27 22 16 15 20 2 0 Same day Next working Within 2 Within 3 Within 4 5 or more Does not apply day working days working days working days working days Particular doctor Any doctor Q4a and 5a. How quickly can you see a doctor?
Yes 5 minutes or less No 6-10 minutes Don't know/never 11-20 minutes needed to 21-30 minutes More than 30 minutes Q6 and 7a. Can you see a GP on the same day if it is urgent? How long do you usually have to wait at the practice? Same day urgent availability of doctor Waiting time at practice
Always Almost always A lot of the time Some of the time Almost never Never Q9a. How often do you get to see your usual doctor?
Very poor Poor Fair Good Very good Excellent Q12a–c. Nurse feedback How well they listen… Quality of care… How well they explain…
169 180 131 150 126 120 Number of responses 90 60 18 13 12 30 5 0 Completely Very Fairly Neutral Fairly Very Completely satisfied satisfied satisfied dissatisfied dissatisfied dissatisfied Q13. How satisfied are you with your practice?
322 340 272 186 204 Number of responses 136 68 0 300 259 Male Female 236 240 180 Number of responses 120 60 0 Yes No Demographics Q14. Sex Q16. Long-standing illness, Disability or infirmary?
White Black or Black British Asian or Asian British Mixed Chinese Other ethnic group Q17 and 18. Ethnic group and accommodation status
264 280 240 200 160 138 Number of responses 120 80 48 26 40 12 12 3 0 Employed Unemployed School or full Long term Looking after Retired Other (full/part time, time education sickness home/family self-employed) Q19. Employment status
The next steps • The results of this survey are a good start to improving your practice • However, you should now discuss your results with your PCT and/or a patient group • Most importantly, you should plan for change!