Download

1 / 24
240 likes | 473 Views
Question:. First Generation diesel EGR will meet the new 2002 air emissions regulations on the road. But at what cost to the Environment?. . . Outline. Understanding: EPA air emissions regulationsDiesel combustionFirst generation diesel EGREffects on combustionSystem and componentsLife Cycle AnalysisResults.

E N D
1. Impact of Heavy Duty Diesel EGR on Air Quality Goals Fred Barrigar, Tim Jacobs,
& Andy McClure
ME-599 Introduction to Ecologically Conscious
Design & Manufacturing Class project, submitted to Professor Skerlos as partial requirement for ME-599-01: Introduction to Ecologically Conscious Design & Manufacturing, December 2001.Class project, submitted to Professor Skerlos as partial requirement for ME-599-01: Introduction to Ecologically Conscious Design & Manufacturing, December 2001.
2. Question: First Generation diesel EGR will meet the new 2002 air emissions regulations on the road.
But at what cost to the Environment?
First generation emissions systems are known for increasing weight, decreasing power, and burning more fuel. They are clearly an important part of the journey toward improved environmental health, but does this first step actually balance out in favor of the environment? This project analyzes the trade-offs involved in reducing the air emissions of heavy-duty roadway diesel semi-tractors via Exhaust Gas Recirculation systems.
Side note:
Technically, the regulations are 2004, but a few years ago EPA caught the engine manufacturers switching to leaner, more NOx producing engine control algorithms in steady-state highway conditions (which are not checked in emissions tests): as part of the court settlement everyone agreed to pull the2004 regulations forward to October 2002.
Other provisions of the �Consent Decree� included:
Civil penalties for engine manufacturers with requirements to allocate the funds for pollution research
Upgrading existing engines to lower NOx emissions (Retrofit Program)
Supplemental steady-state emissions test with an allowable limit equal to the transient standard (FTP) and �not to exceed� limits of 1.25 � FTP (with the exception of Navistar)First generation emissions systems are known for increasing weight, decreasing power, and burning more fuel. They are clearly an important part of the journey toward improved environmental health, but does this first step actually balance out in favor of the environment? This project analyzes the trade-offs involved in reducing the air emissions of heavy-duty roadway diesel semi-tractors via Exhaust Gas Recirculation systems.
Side note:
Technically, the regulations are 2004, but a few years ago EPA caught the engine manufacturers switching to leaner, more NOx producing engine control algorithms in steady-state highway conditions (which are not checked in emissions tests): as part of the court settlement everyone agreed to pull the2004 regulations forward to October 2002.
Other provisions of the �Consent Decree� included:
Civil penalties for engine manufacturers with requirements to allocate the funds for pollution research
Upgrading existing engines to lower NOx emissions (Retrofit Program)
Supplemental steady-state emissions test with an allowable limit equal to the transient standard (FTP) and �not to exceed� limits of 1.25 � FTP (with the exception of Navistar)
3. Outline Understanding:
EPA air emissions regulations
Diesel combustion
First generation diesel EGR
Effects on combustion
System and components
Life Cycle Analysis
Results
4. EPA Emission limits for Heavy heavy-duty diesel engines (HHDDE) with GVWR > 33,000 lbs
Pre-2002:
Effective October 2002:
= 58% reduction! We�re talking about Heavy-Duty diesel engines in road-going trucks
There are 3 classifications for road-going Heavy-Duty diesels which determine emissions lifetime but not emissions limits
Light
Medium
Heavy
Thus, we�re looking at Heavy Heavy-Duty Diesel Engines in road-going trucks
GVWR (Gross Vehicle Weight Rating) for HHDDE > 33,000 lbs
Emissions limit charts:
Yes, there are going to be two ways to certify emissions
Option 2 is expected to be the way most engines will be certified
With a reduction this large, no one can expect it to be an easy task . . .
(In case anyone asks: California emissions limits will be common with Federal for a couple of years, but the next round of reductions will happen be by California ARB before Federal EPA)
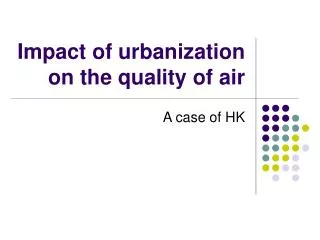
Why?
EPA projects that this rule change will, in 2020, reduce ozone precursors by 1.1 million tons/year and �secondary nitrate particulate matter (which forms in the atmosphere when NOx combines with ammonia) by about 43,000 tons per year.�
As we have covered in this class and the EPA says at their website, �NOx is a major contributor to the formation of ground-level ozone. The new standard will benefit public health because ozone exposure causes a range of human pulmonary and respiratory health effects, including chest pain, coughing, and shortness of breath. In addition to ground-level ozone, the secondary impacts of NOx include the formation of nitrate particulate matter (PM), acid rain, and eutrophication of coastal waters.�
This rule will help states meet Ambient Air Quality standards for ozone and PM, especially in light of the continued industrial expansion of motor vehicle usage. Without this rule change, EPA projects that in 20 years mobile sources would contribute � of all NOx emissions, with HDDE being responsible for a quarter of those.
Sources:
Volvo Trucks, Volvo Trucks Is Driving Towards a Cleaner Environment, Internet at http://www.volvotrucks.us.com/pages/0,1419,328,00.html.
EPA, New Emission Standards for Heavy-Duty Diesel Engines Used in Trucks and Buses, via Internet.
Dieselnet, http://www.dieselnet.com/standards/cycles/ftp_trans.html.
We�re talking about Heavy-Duty diesel engines in road-going trucks
There are 3 classifications for road-going Heavy-Duty diesels which determine emissions lifetime but not emissions limits
Light
Medium
Heavy
Thus, we�re looking at Heavy Heavy-Duty Diesel Engines in road-going trucks
GVWR (Gross Vehicle Weight Rating) for HHDDE > 33,000 lbs
Emissions limit charts:
Yes, there are going to be two ways to certify emissions
Option 2 is expected to be the way most engines will be certified
With a reduction this large, no one can expect it to be an easy task . . .
(In case anyone asks: California emissions limits will be common with Federal for a couple of years, but the next round of reductions will happen be by California ARB before Federal EPA)
Why?
EPA projects that this rule change will, in 2020, reduce ozone precursors by 1.1 million tons/year and �secondary nitrate particulate matter (which forms in the atmosphere when NOx combines with ammonia) by about 43,000 tons per year.�
As we have covered in this class and the EPA says at their website, �NOx is a major contributor to the formation of ground-level ozone. The new standard will benefit public health because ozone exposure causes a range of human pulmonary and respiratory health effects, including chest pain, coughing, and shortness of breath. In addition to ground-level ozone, the secondary impacts of NOx include the formation of nitrate particulate matter (PM), acid rain, and eutrophication of coastal waters.�
This rule will help states meet Ambient Air Quality standards for ozone and PM, especially in light of the continued industrial expansion of motor vehicle usage. Without this rule change, EPA projects that in 20 years mobile sources would contribute � of all NOx emissions, with HDDE being responsible for a quarter of those.
Sources:
Volvo Trucks, Volvo Trucks Is Driving Towards a Cleaner Environment, Internet at http://www.volvotrucks.us.com/pages/0,1419,328,00.html.
EPA, New Emission Standards for Heavy-Duty Diesel Engines Used in Trucks and Buses, via Internet.
Dieselnet, http://www.dieselnet.com/standards/cycles/ftp_trans.html.
5. EPA Heavy-Duty FTP Transient Cycle
EPA Emissions Test:
NYNF = New York non-freeway
Typical of light urban traffic with frequent stops and starts
Notice the time spent idling
LANF = Los Angeles non-freeway
Typical of crowded urban traffic with few stops
Notice the relatively longer times spent moving
LAFY = Los Angeles freeway
Simulates crowded expressway traffic
Always moving, but the throttle, as depicted by the blue line, is opened and closed often with very little time spent in a steady state
And finally the cycle repeats the New York non-freeway section.
During the test, the cycle is carried out twice
First time starts with a cold start (ala overnight)
20 minutes turned off between the two
According to EPA:
Equivalent average speed is about 19 mph
Equivalent distance is about 6.5 miles
Test time is 20 minutes
Average load factor is about 20 to 25% of the maximum horsepower available at a given speed (this is important when we figure out emissions for the transient portion of our �emissions lifetime�)
Source:
Dieselnet, http://www.dieselnet.com/standards/cycles/ftp_trans.html.EPA Emissions Test:
NYNF = New York non-freeway
Typical of light urban traffic with frequent stops and starts
Notice the time spent idling
LANF = Los Angeles non-freeway
Typical of crowded urban traffic with few stops
Notice the relatively longer times spent moving
LAFY = Los Angeles freeway
Simulates crowded expressway traffic
Always moving, but the throttle, as depicted by the blue line, is opened and closed often with very little time spent in a steady state
And finally the cycle repeats the New York non-freeway section.
During the test, the cycle is carried out twice
First time starts with a cold start (ala overnight)
20 minutes turned off between the two
According to EPA:
Equivalent average speed is about 19 mph
Equivalent distance is about 6.5 miles
Test time is 20 minutes
Average load factor is about 20 to 25% of the maximum horsepower available at a given speed (this is important when we figure out emissions for the transient portion of our �emissions lifetime�)
Source:
Dieselnet, http://www.dieselnet.com/standards/cycles/ftp_trans.html.
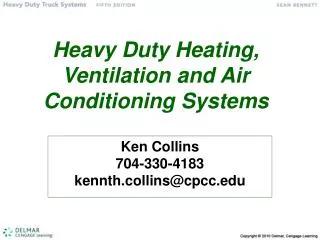
6. EPA EPA is also extending the emissions lifetime of trucks:
HHDDE becomes 435,000 miles/13 years/13,000 hours (but not less than 290,000 miles)
How have the engine manufacturers responded to the challenge?
Emissions lifetime is important for our calculations�lifetime emissions, transportation costs, etc.
Engine manufacturers� response? Ever feel like you�re trying to pull a train by yourself? Battles between EPA & Manfacturers can be like that . . . but ultimately the manufacturers will implement EGR!Emissions lifetime is important for our calculations�lifetime emissions, transportation costs, etc.
Engine manufacturers� response? Ever feel like you�re trying to pull a train by yourself? Battles between EPA & Manfacturers can be like that . . . but ultimately the manufacturers will implement EGR!
7. Diesel Diesel Engines rely on Compression Ignition (CI) of Diesel fuel to provide useful power.
No spark plug
Diesel fuel is injected directly into cylinder.
This creates an extremely heterogeneous mixture of air and fuel in the combustion chamber, producing diffusion-type combustion.
This heterogeneity results in relatively (to Spark Ignition engines) low fuel consumption.
The diffusion-type combustion leads to high torque output.
But, they both lead to increased NOx formation and soot formation Compression Ignition Engine Operation:
1. Air is inducted in the combustion chamber as the piston moves from Top Dead Center (TDC) position to Bottom Dead Center (BDC) position. The intake valve is open during this stroke. Air is usually at a �higher-than-ambient� pressure (and slightly higher temperature) due to turbocharging, which is used on most applications of CI engines. Intercooling helps reduce the compressed air after turbocharging, further increasing the air density (and eventually leading to improved combustion).
2. After the induction process, the intake valve closes and the piston compresses the air as it moves from BDC to TDC.
3. As the piston approaches TDC (anywhere from 40 to 20 degrees before TDC), fuel is injected into the combustion chamber. Most CI engines use direct injection of fuel, however some designs incorporate a �pre-ignition� chamber where the fuel is indirectly injected (injected into pre-ignition chamber, where the fuel ignites and propagates into combustion chamber).
4. Shortly after fuel injection (and while the piston is near TDC), combustion begins. Combustion in a CI engine initially resembles a pre-mix flame, and then quickly transitions into a diffusion burn. The pre-mix flame initiates from the original packets of fuel injected into the chamber. This fuel has considerable time to mix with the air and volatilize. After a chemical delay (molecular separation and energy release), the fuel burns as a flame sheet. However, fuel injected later in the cycle (albeit only milliseconds later), does not adequately mix with the air, and remains as liquid droplets when the pre-mix flame ignites. The pre-mix combustion increases chamber pressure and temperature, which promotes improved mixing of the liquid fuel and air, contributing to volatilization of the fuel (and eventual ignition). Therefore, the pre-mix flame quickly transitions into a diffusion burn, where the flame no longer propagates, rather resides at the stoichiometric boundary of vapor fuel and air.
5. The piston reverses at TDC and expands the volume, as combustion drastically increases cylinder pressures, forcing the piston downward.
6. Near BDC (and long after combustion finished), the exhaust valves open, releasing the contents of the combustion chamber to the exhaust manifold. The piston reverses at BDC, and pumps the products out of the chamber as it moves up to TDC. The process then repeats itself.
The fuel injection graphic shows the spray plume from one injector hole (there can be as many as 8 in one injector per cylinder) at 10 degrees before TDC (piston position). The flame graphic shows how CI, Diffusion Burn combustion looks at 20 degrees after TDC. Notice the heterogeneity of fuel and air in both graphics. Also notice the flame-zones and the no-flame zones in the flame graphic. This heterogeneity leads to high NOx and soot formation.
Graphics supplied by Automotive Research Center, WE Lay Automotive Laboratory, University of Michigan (T. Jacobs).Compression Ignition Engine Operation:
1. Air is inducted in the combustion chamber as the piston moves from Top Dead Center (TDC) position to Bottom Dead Center (BDC) position. The intake valve is open during this stroke. Air is usually at a �higher-than-ambient� pressure (and slightly higher temperature) due to turbocharging, which is used on most applications of CI engines. Intercooling helps reduce the compressed air after turbocharging, further increasing the air density (and eventually leading to improved combustion).
2. After the induction process, the intake valve closes and the piston compresses the air as it moves from BDC to TDC.
3. As the piston approaches TDC (anywhere from 40 to 20 degrees before TDC), fuel is injected into the combustion chamber. Most CI engines use direct injection of fuel, however some designs incorporate a �pre-ignition� chamber where the fuel is indirectly injected (injected into pre-ignition chamber, where the fuel ignites and propagates into combustion chamber).
4. Shortly after fuel injection (and while the piston is near TDC), combustion begins. Combustion in a CI engine initially resembles a pre-mix flame, and then quickly transitions into a diffusion burn. The pre-mix flame initiates from the original packets of fuel injected into the chamber. This fuel has considerable time to mix with the air and volatilize. After a chemical delay (molecular separation and energy release), the fuel burns as a flame sheet. However, fuel injected later in the cycle (albeit only milliseconds later), does not adequately mix with the air, and remains as liquid droplets when the pre-mix flame ignites. The pre-mix combustion increases chamber pressure and temperature, which promotes improved mixing of the liquid fuel and air, contributing to volatilization of the fuel (and eventual ignition). Therefore, the pre-mix flame quickly transitions into a diffusion burn, where the flame no longer propagates, rather resides at the stoichiometric boundary of vapor fuel and air.
5. The piston reverses at TDC and expands the volume, as combustion drastically increases cylinder pressures, forcing the piston downward.
6. Near BDC (and long after combustion finished), the exhaust valves open, releasing the contents of the combustion chamber to the exhaust manifold. The piston reverses at BDC, and pumps the products out of the chamber as it moves up to TDC. The process then repeats itself.
The fuel injection graphic shows the spray plume from one injector hole (there can be as many as 8 in one injector per cylinder) at 10 degrees before TDC (piston position). The flame graphic shows how CI, Diffusion Burn combustion looks at 20 degrees after TDC. Notice the heterogeneity of fuel and air in both graphics. Also notice the flame-zones and the no-flame zones in the flame graphic. This heterogeneity leads to high NOx and soot formation.
Graphics supplied by Automotive Research Center, WE Lay Automotive Laboratory, University of Michigan (T. Jacobs).
8. Diesel NOx emissions in CI engines form from high cylinder temperatures, and air-rich conditions
Diffusion flames burn at the stoichiometric boundary of air and fuel, creating near-adiabatic flame temperatures close to air molecules.
Soot emissions (particulate matter) in CI engines form from poorly aerated fuel droplets not able to fully oxidize during the cycle.
While increased temperatures lead to higher NOx emissions, they also lead to lower soot emissions. There is a tradeoff. NOx forms from the dissociation and re-association of nitrogen and oxygen molecules. Air is mostly composed of molecular nitrogen (N2) and molecular oxygen (O2). In simplified terms, at high temperatures, the O2 dissociates into O, and the N2 dissociates into N. Through different mechanisms, the O and N eventually re-associate to form NO. As the cylinder temperatures decrease, due to the expanding chamber volume and subsiding combustion, NO further oxidizes to NO2. However, there is less time for the NO to fully oxidize to NO2, so most engine emissions are largely composed of NO, with some amounts of NO2. Once the NO enters the atmosphere, it eventually after time fully oxidizes to NO2 (and can contribute to smog formation and acid rain formation).
Soot forms when the liquid fuel (injected before the piston reaches TDC) is not able to completely vaporize (and thus oxidize) during the cycle. A vapor barrier forms around each fuel droplet. At high temperatures, the fuel vapor burns, slowly vaporizing the liquid fuel droplet. However, the surrounding temperatures are quickly dropping due to the expanding combustion volume, and the flame around the liquid droplet quenches. The quenched flame leaves a very small, charred, spherical drop of unburned fuel. This charred droplet leaves the chamber as a soot particle.
The flame diagram, as did the previous slide�s graphics, illustrates the interaction of the hot flame with the air rich zones (no-flame zone). This interaction leads to considerable O2 and N2 dissociation. In the temperature plot (generated from the luminous extraction of the diffusion-burn soot flame), notice that the hottest temperatures are on the fringe of the diffusion flame. This illustrates the stoichiometric boundary, or the mixing boundary, of the diffusion flame. The stoichiometric ratio is almost the hottest an air-fuel mix can burn. The soot plot shows the highest levels of soot form in the coldest regions of the flame (indicated by red and orange zones).
Graphics supplied by Automotive Research Center, WE Lay Automotive Laboratory, University of Michigan (T. Jacobs).NOx forms from the dissociation and re-association of nitrogen and oxygen molecules. Air is mostly composed of molecular nitrogen (N2) and molecular oxygen (O2). In simplified terms, at high temperatures, the O2 dissociates into O, and the N2 dissociates into N. Through different mechanisms, the O and N eventually re-associate to form NO. As the cylinder temperatures decrease, due to the expanding chamber volume and subsiding combustion, NO further oxidizes to NO2. However, there is less time for the NO to fully oxidize to NO2, so most engine emissions are largely composed of NO, with some amounts of NO2. Once the NO enters the atmosphere, it eventually after time fully oxidizes to NO2 (and can contribute to smog formation and acid rain formation).
Soot forms when the liquid fuel (injected before the piston reaches TDC) is not able to completely vaporize (and thus oxidize) during the cycle. A vapor barrier forms around each fuel droplet. At high temperatures, the fuel vapor burns, slowly vaporizing the liquid fuel droplet. However, the surrounding temperatures are quickly dropping due to the expanding combustion volume, and the flame around the liquid droplet quenches. The quenched flame leaves a very small, charred, spherical drop of unburned fuel. This charred droplet leaves the chamber as a soot particle.
The flame diagram, as did the previous slide�s graphics, illustrates the interaction of the hot flame with the air rich zones (no-flame zone). This interaction leads to considerable O2 and N2 dissociation. In the temperature plot (generated from the luminous extraction of the diffusion-burn soot flame), notice that the hottest temperatures are on the fringe of the diffusion flame. This illustrates the stoichiometric boundary, or the mixing boundary, of the diffusion flame. The stoichiometric ratio is almost the hottest an air-fuel mix can burn. The soot plot shows the highest levels of soot form in the coldest regions of the flame (indicated by red and orange zones).
Graphics supplied by Automotive Research Center, WE Lay Automotive Laboratory, University of Michigan (T. Jacobs).
9. EGR EGR reduces cylinder NOx formation by three mechanisms:
Dilution of intake air
EGR reduces pre-mix combustion and prolongs diffusion-burn combustion: both reduce cylinder temperatures
Increased water and CO2 in the combustion chamber
Increases the mixture�s specific heat, leading to reduced combustion temperatures
increased dissociation of these water and CO2 molecules
Dissociation of these (and other complex molecules) leads to reduced combustion temperatures
In summary, EGR reduces NOx formation by reducing combustion temperature. Dilution of Intake Air
Since Diesel engines intake only air during the induction process, a mass of EGR will replace an equal mass of just air (whereas in SI engines, a mass of EGR replaces an equal mass of fuel and air). This is called the dilution effect, since with EGR one is diluting the intake air. The diluted intake air will have less O2 than the non-diluted intake air. This contributes to reduced fuel/air mixing when the fuel is injected. Less fuel/air mixing results in less initial fuel/air vaporization, which leads to less pre-mix combustion (pre-mix combustion dramatically raises combustion temperatures). Furthermore, the mixing-controlled portion of combustion (diffusion-burn combustion) is further hindered by less available oxygen. So, the diffusion-burn portion of combustion also takes longer, releasing it�s energy over a longer part of the cycle (and contributing to lower cylinder temperatures).
The dilution effect is considered the most prominent mechanism for reducing NOx formation in CI engines.
Mixture Heat Capacity increases
Since exhaust products contain water vapor and CO2, so too will EGR. These increased concentrations of water and CO2 increase the overall heat capacity of the mixture, thus requiring more energy to bring the mixture to the same temperature as a non-EGR mixture. If the same mass of fuel is assumed, the corollary is the same amount of energy produces a cooler mixture than a non-EGR mixture. Thus, the combustion temperatures are reduced. The relatively low concentrations of these molecules in the exhaust (particularly Diesel engine exhaust) makes this a secondary effect (although it is the primary effect in SI engines).
Dissociation mechanisms increase
Once again, EGR brings water, CO2, and other complex molecules back into the combustion chamber. These molecules inevitably will dissociate in the high-temperature combustion process. However, dissociation of any molecule requires energy. Therefore, the energy used to dissociate the increased concentrations of these complex molecules leads to a lower temperature. Of course, many of these molecules will �re-associate�, producing energy. However, this re-association occurs to lesser extent (as evidenced by increased levels of CO from EGR-operated engines), and doesn�t contribute the same amount of energy back as it took for dissociation (as evidenced by Second Law principles). Albeit, the relatively small concentrations of these molecules, and the fact that some of them do re-associate, makes this a distant third effect to reducing cylinder temperatures (although still experimentally detectable).Dilution of Intake Air
Since Diesel engines intake only air during the induction process, a mass of EGR will replace an equal mass of just air (whereas in SI engines, a mass of EGR replaces an equal mass of fuel and air). This is called the dilution effect, since with EGR one is diluting the intake air. The diluted intake air will have less O2 than the non-diluted intake air. This contributes to reduced fuel/air mixing when the fuel is injected. Less fuel/air mixing results in less initial fuel/air vaporization, which leads to less pre-mix combustion (pre-mix combustion dramatically raises combustion temperatures). Furthermore, the mixing-controlled portion of combustion (diffusion-burn combustion) is further hindered by less available oxygen. So, the diffusion-burn portion of combustion also takes longer, releasing it�s energy over a longer part of the cycle (and contributing to lower cylinder temperatures).
The dilution effect is considered the most prominent mechanism for reducing NOx formation in CI engines.
Mixture Heat Capacity increases
Since exhaust products contain water vapor and CO2, so too will EGR. These increased concentrations of water and CO2 increase the overall heat capacity of the mixture, thus requiring more energy to bring the mixture to the same temperature as a non-EGR mixture. If the same mass of fuel is assumed, the corollary is the same amount of energy produces a cooler mixture than a non-EGR mixture. Thus, the combustion temperatures are reduced. The relatively low concentrations of these molecules in the exhaust (particularly Diesel engine exhaust) makes this a secondary effect (although it is the primary effect in SI engines).
Dissociation mechanisms increase
Once again, EGR brings water, CO2, and other complex molecules back into the combustion chamber. These molecules inevitably will dissociate in the high-temperature combustion process. However, dissociation of any molecule requires energy. Therefore, the energy used to dissociate the increased concentrations of these complex molecules leads to a lower temperature. Of course, many of these molecules will �re-associate�, producing energy. However, this re-association occurs to lesser extent (as evidenced by increased levels of CO from EGR-operated engines), and doesn�t contribute the same amount of energy back as it took for dissociation (as evidenced by Second Law principles). Albeit, the relatively small concentrations of these molecules, and the fact that some of them do re-associate, makes this a distant third effect to reducing cylinder temperatures (although still experimentally detectable).
10. EGR Not only does EGR reduce NOx formation, it also:
Reduces unburned hydrocarbon (HC) emission
and Increases:
Engine fuel consumption (decreases power)
CO2 release
CO release (dramatically)
H2O release
Soot formation
(particulates)
Golly. . . Is it
worth it? EGR. . .
-Reduces HC since the unburned vapor fuel has a �second chance� to reburn.
-Increases fuel consumption since the reduced cylinder temperatures also reduce cylinder pressures, which reduces power output (and thus increases fuel consumption for any given power output).
-Increases CO2 release, as a direct consequence of increased fuel consumption.
-Increases CO release since the combustion quality is poor with EGR (complete oxidation does not occur as well when operating EGR). Additionally, the increased levels of CO2 in the intake dissociates into CO during the combustion process. Some of this CO may oxidize to CO2, but with reduced levels of O2, not all of re-associates.
-Increases H2O release, again as a direct consequence of increased fuel consumption
-Increases soot formation, since as was already presented, decreased cylinder temperatures leads to increases levels of soot.
Shucks: That�s what we are going to find out!EGR. . .
-Reduces HC since the unburned vapor fuel has a �second chance� to reburn.
-Increases fuel consumption since the reduced cylinder temperatures also reduce cylinder pressures, which reduces power output (and thus increases fuel consumption for any given power output).
-Increases CO2 release, as a direct consequence of increased fuel consumption.
-Increases CO release since the combustion quality is poor with EGR (complete oxidation does not occur as well when operating EGR). Additionally, the increased levels of CO2 in the intake dissociates into CO during the combustion process. Some of this CO may oxidize to CO2, but with reduced levels of O2, not all of re-associates.
-Increases H2O release, again as a direct consequence of increased fuel consumption
-Increases soot formation, since as was already presented, decreased cylinder temperatures leads to increases levels of soot.
Shucks: That�s what we are going to find out!
11. EGR In order to meet the EPA NOx requirements, nearly all HD Diesel Engine manufacturers are using Exhaust Gas Recirculation (EGR) The Exhaust Gas Recirculation (EGR) System works by directing exhaust gas from the exhaust manifold to the intake manifold, where it mixes with the compressed (after turbocharger and intercooler) air. The particular system on the Detroit Diesel Series 60 integrates the EGR system with a variable geometry turbocharger (VGT). A VGT, as opposed to a fixed geometry turbocharger, can change its blade efficiency, improving or disproving the charging output. As a consequence of this changing blade efficiency, there is some control over the exhaust manifold pressure. Therefore, the VGT is used to control the exhaust manifold pressure, which drives the EGR back into the compressed intake air. Increasing exhaust pressure drives more EGR, reducing the exhaust pressure drives less EGR. Note that EGR does not flow at all if the exhaust pressure is less than the intake air pressure (intake manifold pressure).The Exhaust Gas Recirculation (EGR) System works by directing exhaust gas from the exhaust manifold to the intake manifold, where it mixes with the compressed (after turbocharger and intercooler) air. The particular system on the Detroit Diesel Series 60 integrates the EGR system with a variable geometry turbocharger (VGT). A VGT, as opposed to a fixed geometry turbocharger, can change its blade efficiency, improving or disproving the charging output. As a consequence of this changing blade efficiency, there is some control over the exhaust manifold pressure. Therefore, the VGT is used to control the exhaust manifold pressure, which drives the EGR back into the compressed intake air. Increasing exhaust pressure drives more EGR, reducing the exhaust pressure drives less EGR. Note that EGR does not flow at all if the exhaust pressure is less than the intake air pressure (intake manifold pressure).
12. EGR The EGR System is composed of:
An EGR Valve, mounted to the side of a Variable Geometry Turbocharger (VGT)
Stainless Steel EGR Cooler
Stainless Steel Pipe from the valve to the cooler and from the cooler to the Intake Manifold
Steel Pulse Width Modulating Valve
13. EGR Based upon this developmental system, Diesel EGR requires:
Variable Geometry Turbo (VGT): Adds 10lbs Cast Iron beyond existing turbo
VGT EGR Valve: 3lbs Cast Iron
EGR Cooler: 45lbs Stainless Steel
Piping: 10lbs Stainless Steel
VGT Controller: 15lbs Steel
Mechanically controls VGT vane angles
Based on system in U of M engine lab and generally confirmed by a contact at Detroit Diesel
Variable Geometry Turbo�replaces standard fixed geometry turbo
Varies vane angles to adjust exhaust back pressure to control amount of exhaust gas flowing through EGR system. Essentially it balances pressure in exhaust relative to fresh charge intake
VGT EGR Valve�new addition
Controls the entrance to the EGR piping
EGR Cooler�new addition, similar to radiator
Removes heat from the exhaust gas to increase density of charge entering engine to improve thermodynamic efficiency
Stainless steel due to corrosive nature of exhaust gas
Manufactured of Extrusions & stampings by automated assembly and welding
Piping�new
Manufactured of extruded pipe, bent to shape, flared fittings
VGT Controller�new
Mechanically controls VGT vane angles
Consists of numerous rods, linkages, and an electrical motor actuatorBased on system in U of M engine lab and generally confirmed by a contact at Detroit Diesel
Variable Geometry Turbo�replaces standard fixed geometry turbo
Varies vane angles to adjust exhaust back pressure to control amount of exhaust gas flowing through EGR system. Essentially it balances pressure in exhaust relative to fresh charge intake
VGT EGR Valve�new addition
Controls the entrance to the EGR piping
EGR Cooler�new addition, similar to radiator
Removes heat from the exhaust gas to increase density of charge entering engine to improve thermodynamic efficiency
Stainless steel due to corrosive nature of exhaust gas
Manufactured of Extrusions & stampings by automated assembly and welding
Piping�new
Manufactured of extruded pipe, bent to shape, flared fittings
VGT Controller�new
Mechanically controls VGT vane angles
Consists of numerous rods, linkages, and an electrical motor actuator
14. LCA Objective:
Determine whether the EGR system is beneficial to the environment over the emissions lifetime of the truck it is installed upon
Scope:
Evaluate full life cycle of the impact difference between
a truck emitting 6.0 g/bhp�hr without EGR
and
a truck emitting 2.5 g/bhp�hr with EGR Now we get into the meat of the issue:
Objective
We are looking at 1 truck, over the emissions lifetime of that truck as defined by EPA (from previous slide): 435,000 miles/13 years/13,000 hours
Scope
We found new vehicle distributions (as a percentage of vehicles in service) with yearly mileage estimates (by age of vehicles) used by the EPA to plot emissions saved by the rule to measure impact upon the national airshed, but delving into those projections seemed to over complicate the basic question we wanted to answer: Is the first generation EGR an effective way to meet the new requirments
We are looking at the net difference between the old system and the new system with some important exclusions:
Increased beefiness�depends on truck models and corporate approaches
Engine improvements�these will also vary between models/corporations. Also, they are considered proprietary, will not be publicized, will be use proprietary compounds, and are difficult to quantify and evaluate. They include:
Piston coatings (because of increased toughness)
Valves & valve seats (increased cylinder pressure)
More corrosion resistant materials for valves, cam, liners, cylinders, etc.
Turbo parts (increased turbo pressures)
Increased cooling system capability (hotter charges increase engine waste heat rejection)
Condensate management systems (the condensate that forms on the EGR components will likely be acidic from the sulfur in the area)
(The picture is for entertainment only�it does not have EGR on it, but it illustrates an engine in case anyone in the audience is truly clueless)
Source:
EPA, Regulatory Impact Analysis: Control of Emissions of Air Pollution from Highway Heavy-Duty Engines, http://search.epa.gov/s97is.vts.
McKee, Heather, Conversations and Email, Detroit Diesel Corporation.Now we get into the meat of the issue:
Objective
We are looking at 1 truck, over the emissions lifetime of that truck as defined by EPA (from previous slide): 435,000 miles/13 years/13,000 hours
Scope
We found new vehicle distributions (as a percentage of vehicles in service) with yearly mileage estimates (by age of vehicles) used by the EPA to plot emissions saved by the rule to measure impact upon the national airshed, but delving into those projections seemed to over complicate the basic question we wanted to answer: Is the first generation EGR an effective way to meet the new requirments
We are looking at the net difference between the old system and the new system with some important exclusions:
Increased beefiness�depends on truck models and corporate approaches
Engine improvements�these will also vary between models/corporations. Also, they are considered proprietary, will not be publicized, will be use proprietary compounds, and are difficult to quantify and evaluate. They include:
Piston coatings (because of increased toughness)
Valves & valve seats (increased cylinder pressure)
More corrosion resistant materials for valves, cam, liners, cylinders, etc.
Turbo parts (increased turbo pressures)
Increased cooling system capability (hotter charges increase engine waste heat rejection)
Condensate management systems (the condensate that forms on the EGR components will likely be acidic from the sulfur in the area)
(The picture is for entertainment only�it does not have EGR on it, but it illustrates an engine in case anyone in the audience is truly clueless)
Source:
EPA, Regulatory Impact Analysis: Control of Emissions of Air Pollution from Highway Heavy-Duty Engines, http://search.epa.gov/s97is.vts.
McKee, Heather, Conversations and Email, Detroit Diesel Corporation.
15. LCA Assumptions:
Emission equipment will be maintained
Trucks utilize on-board diagnostics systems (OBD-II) like current automobiles
Emissions inspections take place
Equipment will be renewed as necessary during regular engine rebuilds
Other emissions equipment will not be added to the trucks
Refer to EPA�s Voluntary Diesel Retrofit Program
Over this type of vehicle�s life, operation is mostly at steady-state, which is excluded from EPA�s FTP test
So we developed our own method to estimate lifetime emissions EPA�s Voluntary Diesel Retrofit Program:
EPA has a program which provides information and funding to fleet owners who apply engine emission related upgrade kits and catalytic converter kits to their heavy duty diesel fleet
This program can be part of a SIP program for non-attainment areas
One large scale example is happening at Boston�s Big Dig construction program
Source
EPA, http://www.epa.gov/otaq/transp/vmweb/vmhvydty.htm.EPA�s Voluntary Diesel Retrofit Program:
EPA has a program which provides information and funding to fleet owners who apply engine emission related upgrade kits and catalytic converter kits to their heavy duty diesel fleet
This program can be part of a SIP program for non-attainment areas
One large scale example is happening at Boston�s Big Dig construction program
Source
EPA, http://www.epa.gov/otaq/transp/vmweb/vmhvydty.htm.
16. LCA Method
Measure
Emissions
Fuel consumption, and
Power output on a stationary Detroit Diesel Corp.
Series 60 engine equipped with an experimental
EGR system with different operating algorithms
Quantify impact on Brake Specific Fuel Consumption (BSFC)
Estimate lifetime emissions of
NOx
CO2
CO
Hydrocarbons
H2O
Engines must still meet power requirements, so if BSFC goes down, more fuel must be supplied to obtain the same power output.
This causes increased fuel consumption, increased emissions, etc.
Engines must still meet power requirements, so if BSFC goes down, more fuel must be supplied to obtain the same power output.
This causes increased fuel consumption, increased emissions, etc.
17. LCA Method (continued)
Estimate EGR Components�:
Materials, masses, and manufacturing processes
Estimate transportation costs associated with the EGR system
lifetime fuel consumption per kilogram
Use ECO99 to estimate environmental impact of the
NOx reduction
Emissions increases and decreases
Extra fuel production
Component manufacture
We identified five main components on the heavy-duty diesel engine that would either have to be manufactured or modified from the original to be placed on the diesel engine.
VGT Turbocharger
EGR Valve
VGT Controller
EGR Cooler
EGR Piping
These components were analyzed for their life cycle assessment.
The processes assumed for each component are:
-�The EGR valve, we assumed that we were going to cast the outerbody (using cast iron) and then stamp the flapper valve (also cast iron). Stamping was not found in the database so it was placed as NA (not available).
-�The EGR Cooler was assumed to be 100% stainless steel and this was going to be rolled and then brazed (we used MIG welding as a reference since brazing was not listed in the SIMAPRO database).
-�The VGT Controller is a complex component but we simplified it down to a series of rods, linkages, and an electric motor actuator. We assumed each of these to be cast steel. After being cast, we only assumed machining, and turning to get the final shapes.
-�The pipes for the EGR system were assumed to be 100% stainless steel. These would be rolled, bent, and then flared. We could not find any type of flaring process in the SimaPro database, but assumed its impact to be insignificant.
-�The VGT was only assumed to have the nozzle ring assembly, and larger housings. The nozzle ring assembly was assumed to be stainless steel to resist high heat and corrosion. The turbine housing was assumed a cast steel and the compressor housing a cast aluminum.
We defined the scope to include material production, and manufacturing. Each of these were weighted using the egalitarian method in the Simapro software explained earlier in the presentation. Transportation of parts from one plant to another was omitted because the data within the SimaPro database was not accurate for our needs. It was also deemed inconsequential in comparison to the rest of the data involved in the environmental analysis. Lastly we did not use recycling to analyze our materials used in component manufacturing. The recycling estimates that were given in SimaPro did not seem accurate for the materials that we were using and our application.
After the environmental analysis, we analyzed each component for cost and calculated an estimated cost for the system to be added to the engine. Most of the cost data was taken from EPA�s paper on �Estimated Economic Impact of New Emission Standards for Heavy-Duty On-Highway Engines� written in March 1997. In reality, the costs given in this paper 4 years ago are slightly lower than current costs due to advancements made in EGR technology. Therefore, our analysis covers a worst-case scenario.
For supporting data, see Diesel_Components.XLS This spreadsheet will give a summary of the relative impacts of cost and environmental weights due to manufacturing and material production.
Source:
PR� Consultants, SimaPro5, Amersfoort, The Netherlands
�Estimated Economic Impact on New Emission Standards for Heavy-Duty On-Highway Engines.� United States Environmental Protection Agency. March 1997
18. LCA ECO-99
SimaPro5, PR� Consultants
American versions of such software not available
All value systems and distances are based on European methods
Egalitarian method (E/A)
Long range effects are important to consider
Time proves more questionable substances harmful rather than harmless
Weighted 40/40/20%
Entered our quantities for
NOx emissions
Other increased emissions
Extra fuel required (due to increased consumption by the combustion process and transportation of the components during emissions life)
Component materials and manufacturing processes
Details are shown in supporting appendices (several Excel sheets)
Add plug for the need to develop such evaluation systems for America
Egalitarian method assumes resources are not substitutable, which we don�t agree with, but this is minor compared to the other assumptions
Determined our quantities by:
Engine test cell results shown in graphs in appendix document Diesel_System.XLS
Determining average engine load and rpm during urban cycle from federal FTP emissions test
Determining average engine load and rpm during steady state travel (highway) from an EPA �speed at load� bubble chart
Weighted the two 10% / 90% since we are dealing primarily with over the road hauling trucks (OTR)
Thus calculated values and extended them over the 13,000 hour emissions life
19. LCA Materials & Manufacturing Processes
Major material impact is small amount of cast aluminum
Welded stainless steel has a large impact due to processes and heavy metals
We identified five main components on the heavy-duty diesel engine that would either have to be manufactured or modified from the original to be placed on the diesel engine.
VGT Turbocharger
EGR Valve
VGT Controller
EGR Cooler
EGR Piping
These components were analyzed for their life cycle assessment.
We defined the scope to include material production, and manufacturing. Each of these were weighted using the egalitarian method in the Simapro software explained earlier in the presentation. Transportation of parts from one plant to another was omitted because the data within the SimaPro database was not accurate for our needs. It was also deemed inconsequential in comparison to the rest of the data involved in the environmental analysis. Lastly we did not use recycling to analyze our materials used in component manufacturing. The recycling estimates that were given in SimaPro did not seem accurate for the materials that we were using and our application.
After the environmental analysis, we analyzed each component for cost and calculated an estimated cost for the system to be added to the engine. Most of the cost data was taken from EPA�s paper on �Estimated Economic Impact of New Emission Standards for Heavy-Duty On-Highway Engines� written in March 1997. In reality, the costs given in this paper 4 years ago are slightly lower than current costs due to advancements made in EGR technology. Therefore, our analysis covers a worst-case scenario.
For supporting data, see Diesel_Components.XLS This spreadsheet will give a summary of the relative impacts of cost and environmental weights due to manufacturing and material production.
Source:
PR� Consultants, SimaPro5, Amersfoort, The Netherlands
�Estimated Economic Impact on New Emission Standards for Heavy-Duty On-Highway Engines.� United States Environmental Protection Agency. March 1997We identified five main components on the heavy-duty diesel engine that would either have to be manufactured or modified from the original to be placed on the diesel engine.
VGT Turbocharger
EGR Valve
VGT Controller
EGR Cooler
EGR Piping
These components were analyzed for their life cycle assessment.
We defined the scope to include material production, and manufacturing. Each of these were weighted using the egalitarian method in the Simapro software explained earlier in the presentation. Transportation of parts from one plant to another was omitted because the data within the SimaPro database was not accurate for our needs. It was also deemed inconsequential in comparison to the rest of the data involved in the environmental analysis. Lastly we did not use recycling to analyze our materials used in component manufacturing. The recycling estimates that were given in SimaPro did not seem accurate for the materials that we were using and our application.
After the environmental analysis, we analyzed each component for cost and calculated an estimated cost for the system to be added to the engine. Most of the cost data was taken from EPA�s paper on �Estimated Economic Impact of New Emission Standards for Heavy-Duty On-Highway Engines� written in March 1997. In reality, the costs given in this paper 4 years ago are slightly lower than current costs due to advancements made in EGR technology. Therefore, our analysis covers a worst-case scenario.
For supporting data, see Diesel_Components.XLS This spreadsheet will give a summary of the relative impacts of cost and environmental weights due to manufacturing and material production.
Source:
PR� Consultants, SimaPro5, Amersfoort, The Netherlands
�Estimated Economic Impact on New Emission Standards for Heavy-Duty On-Highway Engines.� United States Environmental Protection Agency. March 1997
20. LCA Transportation costs
EGR Added 83kg mass of components, on a 33,000 lb truck, over 13 years and 435,000 mi, costs
186 gallons = 586kg of diesel fuel
This is points over a truck without EGR
For details see Diesel_Trans_Costs.XLSThis is points over a truck without EGR
For details see Diesel_Trans_Costs.XLS
21. LCA�Combustion Increased Fuel Production & Alternate Emissions due to Power Loss Effects
Power loss effects are offset by burning more fuel to haul the same load Negative numbers = Environmental Improvement because this is the difference between a current truck without EGR and one meeting the 2002 regulations with EGR. Therefore, the numbers are based on an engine management strategy of 2.5g NOx instead of 6.0g NOx.
Notice that
Resource use increases due to the extra fuel
The benefits to Human Health and Ecological Quality are quite large
For details see Diesel_Systems.XLSNegative numbers = Environmental Improvement because this is the difference between a current truck without EGR and one meeting the 2002 regulations with EGR. Therefore, the numbers are based on an engine management strategy of 2.5g NOx instead of 6.0g NOx.
Notice that
Resource use increases due to the extra fuel
The benefits to Human Health and Ecological Quality are quite large
For details see Diesel_Systems.XLS
22. LCA Who wins? The fact that use phase combustion benefits are in MegaPoints and the other parts are in Points means that the use phase combustion dwarfs the component and transportation costs
Total Benefit to Human Health = 14.5 million points
Total Benefit to Ecological Quality = 4.6 million points
Total Benefit to Resources = 3.3 million points For the Worse
Total ECO-99 Impact = 15.8 million points per Truck improvement
In our opinion, Heavy-Duty Diesel Engine EGR is beneficial to Society
Clearly, this is EPA�s conclusion tooThe fact that use phase combustion benefits are in MegaPoints and the other parts are in Points means that the use phase combustion dwarfs the component and transportation costs
Total Benefit to Human Health = 14.5 million points
Total Benefit to Ecological Quality = 4.6 million points
Total Benefit to Resources = 3.3 million points For the Worse
Total ECO-99 Impact = 15.8 million points per Truck improvement
In our opinion, Heavy-Duty Diesel Engine EGR is beneficial to Society
Clearly, this is EPA�s conclusion too
23. Cost!
Further issues
Impacts on Reliability?
Next emissions reduction legislation
Widespread proliferation of fuel injection rate-shaping, exhaust after-treatment, fuel reformulations, catalysts, PM traps . . .
Further Impacts Dollar cost
We didn�t consider cost due to the difficulty of getting engine manufacturers to release �competitive� information early, but the EPA projects a near term engine retail price of $260-$470 per vehicle. They also project that the cost will decrease by half over the next five years. EPA claims this price increase represents a 2 to 4% increase in engine price and less than 1% increase �in the price of most new heavy-duty vehicles.�
(This sounds low to us with our level of experience)
Many fleets fight for every penny, but this seems like a pretty good deal when weighed with environmental impact (if durability is in fact maintained)
Reliability
Reliability must be assured: the system must be validated to the �emissions life of the engine,� but any new component, let alone system, has �teething pains.� On-Board Diagnostics systems monitor emissions systems for emissions failures, which result in downtime for the trucks. �Walk home� breakdowns, which may occur since the EGR system is tied to the intake system via the turbo charger, can stop freight shipments and shut down factories, resulting in very high costs (admittedly, tight shipment systems, such as Toyota�s lean manufacturing logistics shipper, have contingency plans).
Engine manufacturers are making complementary changes to engine components, such as improved integrity piston crowns, rings and cylinder liners to deal with the recirculated exhaust, increased oil change frequency due to nastier piston blow-by
Next step in emission reduction legislation is well under way.
Source:
EPA, New Emission Standards for Heavy-Duty Diesel Engines Used in Trucks and Buses, report EPA420-R-00-010 via Internet.Dollar cost
We didn�t consider cost due to the difficulty of getting engine manufacturers to release �competitive� information early, but the EPA projects a near term engine retail price of $260-$470 per vehicle. They also project that the cost will decrease by half over the next five years. EPA claims this price increase represents a 2 to 4% increase in engine price and less than 1% increase �in the price of most new heavy-duty vehicles.�
(This sounds low to us with our level of experience)
Many fleets fight for every penny, but this seems like a pretty good deal when weighed with environmental impact (if durability is in fact maintained)
Reliability
Reliability must be assured: the system must be validated to the �emissions life of the engine,� but any new component, let alone system, has �teething pains.� On-Board Diagnostics systems monitor emissions systems for emissions failures, which result in downtime for the trucks. �Walk home� breakdowns, which may occur since the EGR system is tied to the intake system via the turbo charger, can stop freight shipments and shut down factories, resulting in very high costs (admittedly, tight shipment systems, such as Toyota�s lean manufacturing logistics shipper, have contingency plans).
Engine manufacturers are making complementary changes to engine components, such as improved integrity piston crowns, rings and cylinder liners to deal with the recirculated exhaust, increased oil change frequency due to nastier piston blow-by
Next step in emission reduction legislation is well under way.
Source:
EPA, New Emission Standards for Heavy-Duty Diesel Engines Used in Trucks and Buses, report EPA420-R-00-010 via Internet.
24. Expect rapid progress
Automobile gasoline IC engine emissions equipment has had stunning success over the long term
Substantial amounts of public and private money are funding research addressing this issue
EPA and manufacturers are already implementing the next stage of emissions requirements as a �retrofit program�
We can expect continued progress in the development of the EGR system and HHDDE emissions reductions
In Conclusion:
In the 33 years since automotive emissions equipment was introduced, industry has reduced emissions dramatically. As an additional benefit to consumers, much of the research and improved control technologies developed for emissions have also boosted power and performance through increased engine tolerance control and improved combustion control.
Sources:
Dieselnet.com � a consortium of diesel manufacturers, http://www.dieselnet.com/standards/us/hd.html
EPA, In the 33 years since automotive emissions equipment was introduced, industry has reduced emissions dramatically. As an additional benefit to consumers, much of the research and improved control technologies developed for emissions have also boosted power and performance through increased engine tolerance control and improved combustion control.
Sources:
Dieselnet.com � a consortium of diesel manufacturers, http://www.dieselnet.com/standards/us/hd.html
EPA,
25.
Want to be your friends! (sometimes) Well, maybe not always the environment�s friend . . . but we�re getting there!Well, maybe not always the environment�s friend . . . but we�re getting there!