Download
1 / 54
540 likes | 655 Views
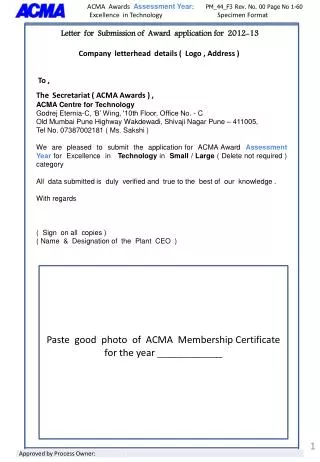
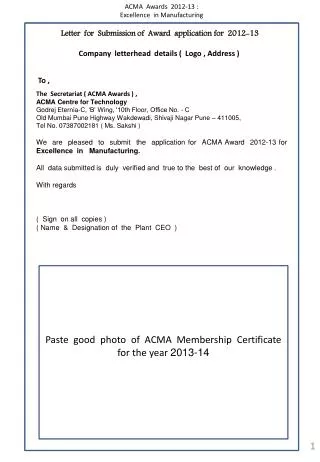
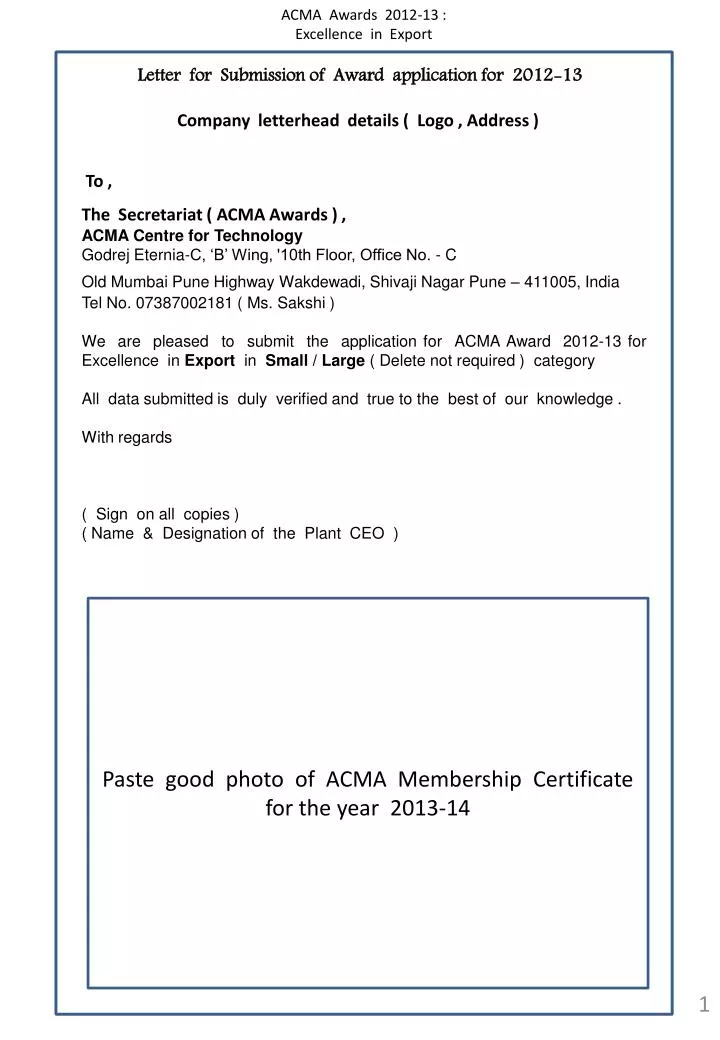
Letter for Submission of Award application for 2012-13. Company letterhead details ( Logo , Address ). To , The Secretariat ( ACMA Awards ) , ACMA Centre for Technology Godrej Eternia-C, ‘B’ Wing, '10th Floor, Office No. - C

E N D
Letter for Submission of Award application for 2012-13 Company letterhead details ( Logo , Address ) To , The Secretariat ( ACMA Awards ) , ACMA Centre for Technology Godrej Eternia-C, ‘B’ Wing, '10th Floor, Office No. - C Old Mumbai Pune Highway Wakdewadi, Shivaji Nagar Pune – 411005, IndiaTel No. 07387002181 ( Ms. Sakshi ) We are pleased to submit the application for ACMA Award 2012-13 for Excellence in Export in Small / Large ( Delete not required ) category All data submitted is duly verified and true to the best of our knowledge . With regards ( Sign on all copies ) ( Name & Designation of the Plant CEO ) Paste good photo of ACMA Membership Certificate for the year 2013-14 1
Company’s Details • Name of the corporate group (if company is part of a corporate group): - • ( Underline the plant for which application is sent ) • Plant 1 • Plant 2 • Plant 3 • Plant Address for which application is sent : • 2. Name of the Chief executive of the corporate group- • Chief Executive (Applicant Plant) details : • Name : Designation : • Mobile : E-mail : • Land line with extension : Fax No. • 4. Plant Head ( Next to Chief Executive (Site)) details : • Name : Designation : • Mobile : E-mail : • Land line with extension : Fax No. • ( If Sr. No. 3 & 4 are same , then provide next level person details at Sr. No. 4 )
Company’s Details • Company turnover ( in Rs. Crore ) for Year 2012-13 : • Plant turnover ( in Rs, Crore ) for Year 2012-13 : • Year of Establishment : Company _______ , Plant ___________ • Total Employees : Company ___________ , Plant _____________ • Do you have a Joint Venture : ( If Yes , Mention the partner name ) • Company’s Key products : • 11. Plant’s Key products : • Plant’s key manufacturing processes : • Key competitors : • 14. Key Suppliers : • 15. Major Certifications :
Customer Details As a part of ACMA Award process , feedback from your major customers will be obtained directly and will be provided to Jury as a part of Site Assessment Report. The same will be provided to you as a part of Site Assessment feedback report Kindly provide 2 names per Key Customers for the plant for which application is being sent.
Company / Plant Information ( page 1 of 2 ) Use slide no. 5 and 6 to brief about your company / Plant . It includes Product names / photos , Plant facility photographs ,
Company / Plant Information ( page 2 of 2 ) Use slide no. 5 and 6 to brief about your company / Plant . It includes Product names / photos , Plant facility photographs ,
Route Map to reach your plant Provide here route map to your company for site assessment ( Site assessment is carried out if your application is shortlisted by Jury ) Contact person name & Designation: Name : Designation : E-Mail : Mobile : Landline : ( STD Code ) ( Number ) : Ext. ( if any )
( For office use only ) Company performance at a glance ( Following radar chart shows the scores for each main area as per questionnaire , scores are converted to % ) RADAR Chart
( For office use only ) Section 1 Work Environment & Employee Involvement. Total Marks = 150
Work Environment and employee engagement (1.A) 5S Total= 40 (i)illustrate how concept of 5S/house keeping has been deployed in your plant?(10 ) (ii) What methods are adopted to assess 5S levels/scores? (show last one year trend in line graph). (20) Formula 5 S Score = Lowest zone / area score of that month in % / 30 Remarks :
Work Environment and employee engagement (1.A) 5S Total= 40 (iii) illustrate with photographs examples of good Visual Factory- Before and after. (10) Before After Before After / 10 Remarks :
Work Environment and employee engagement (1.B) Suggestions / Kaizens Per Employee Total= 10 (i) Is there a suggestion scheme in the company and How company encourages employees to give suggestions? ? Pls Describe: (ii) How company ensures the suggestions are implemented? Pls describe: (iii) Trends of number of suggestions implemented / employee / month? (show last one year trend in line graph). Formula Total suggestions + Kaizen Implemented in that month Suggestions / Employee =---------------------------------- -------------------------------- X 100 Total direct employees ( Operatives ) for the month / 10 Remarks :
Work Environment and employee engagement (1.C) Absenteeism Total= 10 (i) What is absenteeism data ( Average) for the year 2012-13 ? What are the trends in regards to total absenteeism? (Three year trend in bar graph) ( 5 ) Authorized = % Unauthorized = % Total = % Formula Total absent man-hours for the month ( Authorized + Unauthorized ) Absenteeism =-------------------------------------------------------- -------------------------------- X 100 Total man hours for the month (ii) What efforts organization takes to reduce absenteeism? ( 5 ) 10
Work Environment and employee engagement (1.D) TRAINING Total= 10 • (i) In which areas do you provide training to your employees ? List some benefits achieved by trainings in recent past. What is the trend of the training hours / employee over the years? (show last three year trend in bar graph) ( 5 ) • Training Areas : Formula Total training man-hours for all employees for year Training hours/employee / year =---------------------------------------- --------------------- Total employees (ii) Benefits of Training : Tangible ( in Rs. Lacs ) & Intangible : ( 5 ) 10
Work Environment and employee engagement (1.E) Small Group Activities Total= 10 • Explain how company encourages small group activities : • (ii) Do small group participate in the Quality Conventions-Group/State level/National. Show certificates / trophy photographs : (iii) How many active groups are present in the current year? % employee involvement In QC Activity? (show last three year trend in bar graph) % Employees Involvement No. of Active groups 10
Work Environment and employee engagement (1.F) SAFETY Total= 40 • Pls describe: with text / Photos • How company ensures Safe work practices? (5) • (ii)Proactive measures taken by company to reduce accidents (10) • (iii)Number of accident free days ( Cumulative ) (5) : Days 20
Work Environment and employee engagement (1.F) SAFETY Total= 40 • (iv)What are the current accident levels? (Show last one year data in line graph) • A) Frequency (rate) (Minor + Major Accidents) (10) • B) Severity (rate) (10) Formula No. of accidents Frequency rate =------------------------ X 106 Total man hours Formula Total man-days lost Severity rate =------------------------------- X 106 Total man hours 20
Work Environment and employee engagement (1.G) Environment Management Total= 30 (i) What is the frequency of scrap disposal? (10) : (Pl explain is it Daily / Weekly ) (ii) Does company have resources conservation strategy? List some recent achievements of company to conserve resource -electricity, water, material? (10) 20
Work Environment and employee engagement (1.G) ENVIRONMENT MANAGEMENT Total= 30 (iii) Please describe the practices of the company to reduce pollution ? (10) 10
( For office use only ) Section 2 Customer Assessment Total Marks = 150
2. CUSTOMER ASSESSMENT (2.A ) Share Of Business with 3 Major Export Customers Total= 30 (i)% SOB with Major 3 Export Customers (show last 3 yr trend) (20) (ii) Why business has reduced or Improved ? Explain with case to case (10) 30
2. CUSTOMER ASSESSMENT (2.B ) Customer Feedback Total= 50 (i) Please describe system of getting feedback from the customers? (50) 50
2. CUSTOMER ASSESSMENT (2.C ) Feedback Analysis Total= 40 (i) How do you analyze this feedback and take actions in weak areas? Explain with a case study. (40) 40
2. CUSTOMER ASSESSMENT (2.D ) Customer Awards Total= 30 (i) Awards / Recognition by Key Customers from Domestic and Export Customers (trend of last 3 years) (30) Note : If your Customer does not have a system of Awards , Mention what kind of supplier recognition is followed by Customer . Award photo Award photo 30
( For office use only ) Section 3 Export Operation Performance Total Marks = 350
3. Export Operation Performance (3.A) Exports Sales Total= 100 (I) Total sales in Rs. Crore and % of total Sales Growth ( Last 3 years Trend) – (20) (ii) How Total sales improved ? If not improved , what are the reasons ? (20) 40
3. Export Operation Performance (3.A) Export Sales Total= 100 (iii) Total Export Sales , In Rs. Crore and % growth in Export Sales ( Last 3 years Trend) – (30) (iv) How export sales improved ? If not improved , what are the reasons ? (30) 60
3. Export Operation Performance (3.B) OEM / Tier 1 Export Sales Total= 50 (i) OEM/Tier 1 Export Sales and % of Total Exports (In Rs Crore ) ( last 3 years Trend) – (15) (ii) How has OEM / Tier 1 sales improved ? If not improved , what are the reasons ? (15) 30
3. Export Operation Performance (3.B)OEM / Tier 1 Export Sales Total= 50 (iii) Total aftermarket Export Sales , In Rs. Crore and % growth in After Market Export Sales ( Last 3 years Trend) – (10) (iv) How has Aftermarket sales improved ? If not improved , what are the reasons ? (10) 20
3. Export Operation Performance (3.C)Foreign Exchange Earned Total= 100 (i)Net foreign exchange earned in Rs. Crore ? (30) (ii) What are the efforts taken to improve Net foreign exchange ? (20) 50
3. Export Operation Performance (3.C) Foreign Exchange Earned Total= 100 (iii) Net foreign exchange earned through Reduction in Imports (Rs. Crore ) ? (30) (iv) How Import reduction achieved ? (20) 50
3. Export Operation Performance (3.D) New Product added for Export Total= 50 (i) Number of new products added from existing product portfolio for export market and % of sales contribution from these new products to Exports in last three years –show 3 years trend graph. (20) (ii) Number of entirely new products added and % of sales contribution from these new products to Exports in last three years –show 3 years trend graph (20) 40
3. Export Operation Performance (3.D) New Product added for Export Total= 50 (iii) Show process / roadmap for development of new products for export and its achievement status (10) 10
3. Export Operation Performance (3.E)Royalty Payments Total= 50 (i) Royalty payments over last 3 years in Rs.. Crore ) ? (30) (ii) How have royalty payments reduced ? (20) 50
( For office use only ) Section 4 Export Market Performance Total Marks = 200
4. Export Market Performance (4.A) Export Growth in Established Market Total= 150 (i) Export destinations (Names) – (20) (ii) Principal OEMs / Tier 1 customers – (20) 40
4. Export Market Performance (4.A) Export Growth in Established Market Total= 150 (iii) Export Growth in established Market (Rs. Crore ) Last 3 years Trend for Developed Countries ? (40) ( You can edit / add your export countries in this graph ) (iv) What are the initiatives to improve growth in developed countries ? ( 20 ) 60
4. Export Market Performance (4.A) Export Growth in Established Market Total= 150 (v) Export Growth in developing Market (Rs. Crore ). Last 3 years Trend for Developing countries (30) ) ( You can edit / add your export countries in this graph ) (iv) What are the initiatives to improve growth in developing countries ? ( 20 ) 50
4. Export Market Performance (4.B) Breakthrough Achievements for capturing new Markets Total= 50 (i) Cost competitiveness for capturing new markets (20) (ii) Use of Technology for capturing new markets (10) 30
4. Export Market Performance (4.B) Breakthrough Achievements for capturing new Markets Total= 50 (iii) Quality and Delivery performance for capturing new markets (10) (iv) Through Innovation (10) 20
( For office use only ) Section 5 Quality Performance Total Marks = 150
5. Quality Performance (5.A) In-House Rejection Total= 30 (i) What are the trends of the Total in-house rejection in PPM ? (show last 3 year data in bar graph) (10) (ii) Please describe the actions taken to reduce the in- house rejection (10) 20
5. Quality Performance (5.A) In-House Rejection Total= 30 (iii) Provide example of actions by which you are able to achieve zero defect for In-House rejection (10) Before – After Photo Before After 10
5. Quality Performance (5.B) Cost of poor Quality ( COPQ ) Total= 20 (i) What is the trend for COPQ ? (show last 3 year data in bar graph (5) Cost of Poor Quality ( COPQ ) as % of Sales (iii) Show elements of Cost of poor quality and improvements for the year 2012-13 . ( 10 ) 15
5. Quality Performance (5.B) Cost of poor Quality Total= 20 (iii) Provide example of actions by which you are able to reduce COPQ ( 5 ) Before – After Photos Before After Before After 5
5. Quality Performance (5.C) Rework Total= 30 (i) What is the current level of the rework in PPM ? (show trend for last 3 year in bar graph) (10) (ii) Explain efforts taken to reduce rework : (10) 20
5. Quality Performance (5.C) Rework Total= 30 (iii) Please give details of action taken to reduce rework? (10) Before – After Photo Before After 10
5. Quality Performance (5.D) Poka-yoke Total= 20 (i) What % of CTQs are controlled by Poka Yoke? Give examples (5) % = (ii) What % of Customer complaints are closed by Poka Yoke in 2012-13 ? Provide examples (5) % = 10
5. Quality Performance (5.D) Poka-yokes Total= 30 (iii) Show innovative examples of poka-yoke & Effect on overall Rejection of that Product ( 10 ) Before – After Photo Before After 10
5. Quality Performance (5.E) Customer Complaints Total= 30 (I) Customer complaints for Domestic and export customers (show last 3 yr trend) (10) (ii) What actions are initiated to eliminate export Complaints ? (20 ) 30