Download
1 / 34
340 likes | 625 Views
Ventilation: Physiology Made Simple (although may still be a little boring). Dr M Bloch Anaesthetics Consultant NHSG. Overview. Why? Basic anatomy, breathing basics & basic physiology Oxygen delivery. Why?.

E N D
Ventilation: Physiology Made Simple (although may still be a little boring) Dr M Bloch Anaesthetics Consultant NHSG
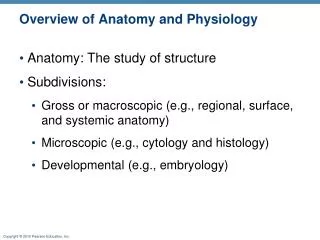
Overview • Why? • Basic anatomy, breathing basics & basic physiology • Oxygen delivery
Why? • To develop a foundation of knowledge of the physiology of the respiratory system that will enable systematic and considered approach to the care of the critically ill patient. • To understand the impact of acute and chronic pathological processes on their presentation and treatment.
Oxygen demand and supply: • Supply of O2 to the tissues requires the integration & regulation of 3 systems: • the lungs • the blood • the circulation A B C
Decrease O2 delivery Decreased coronary flow Tachycardia Diastolic hypotension Hypocapnia (vasoconstriction) Coronary artery spasm Increased preload / afterload (wall tension) Decreased O2 content Anaemia Arterial hypoxaemia Shift of ODC to left Increased O2 demand Sympathetic stimulation Tachycardia Increased myocardial contractility Increased preload / afterload (wall tension) Myocardial O2 Supply vs. demand
Some ANATOMICAL differences are more difficult to deal with than others…
Anatomy Trachea 1 Conducting airways Deadspace of ~150ml Gas moves by inspiration Right & Left main bronchus Lobar, segmental and terminal bronchii 16 Respiratory bronchioles Respiratory airways. Just a few millimeters thick Contain 2-3L at rest = most of the lung volume Gas movement is by diffusion, Occurs within a second Alveolar ducts Alveolar sacs 23
Structure and innervation • Thoracic structure • 12 pairs of ribs. • Articulate with vertebrae posterior. • Drop inferior at anterior aspect at rest in expiration. • Articulate at the front with the sternum via costal cartilage. • Inferior aspect of thoracic cage bordered by diaphragm.
Innervation • Diaphragm: phrenic nerve C3-5 used in quiet respiration. • Intercostal nerves on inferior aspect of rib supplies the intercostal muscles which are used in forceful respiration. • Direct lung innervation limited because of paucity of fibres. • Sensitive to humoral influences.
Control of Respiration chemoreceptors on aorta and carotid artery brain respiratory centres in medulla heart intercostal nerve to external intercostal muscles phrenic nerve to diaphragm ribs diaphragm
VT (tidal volume) 500ml Anatomic deadspace 150ml Alveolar gas volume 3000ml Ventilatory rate ~15 Total ventilation 7.5L/min Alveolar ventilation = (500-150).15 = approx 5L/min = Cardiac output. Lung volumes
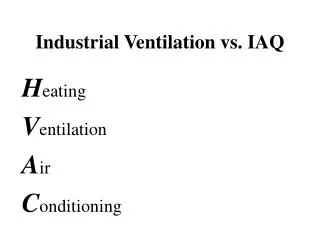
E ffort E fficacy E ffect
Ventilation-perfusion mismatch and the alveolar-arterial pO2 difference. • VA/Q mismatch is an inequality in either ventilation or perfusion. • Ratio of ventilation to perfusion varies • Range from zero to infinity! • Ideal ratio is 0.8 (0.5-2.0)
V/Q mismatch • Ventilation increases gradually as you move from apex to base • Perfusion poor in apices better at bases • V/Q ratio decrease as you move down from apices • A) Well-ventilated poorly perfused (V>Q) • B) Underventilated well perfused (V<Q) • C) Optimally ventilated + perfused (V=Q)
Complete Form: Clinically Useful Form: Ideal Alveolar Gas Equation.
A-a Difference • PAO2 - PaO2 • A-a = FiO2 – PaCO2 – PaO2 • Normally up to +/- 25 mmHg • Because of normal anatomical shunt • Ventilation/Perfusion mismatching. • A-a difference increases with pulmonary disease. 50 21 80 45 5 16 5 75 5 12 13 18 33 3 57
a/A ratio • Normally averages just over 0.8 • a/A ratio falls with pulmonary disease. • Lower limit normal: • young (room air) : 0.74 • older (room air) : 0.78 • Both groups (100% O2): 0.82
Oxygen carriage • Is either carried bound to Hb or dissolved • Oxygen dissociation curve • Henry’s Law for dissolved blood • Amount of oxygen dissolved in the blood is equal to the partial pressure of oxygen • For each mmHg pO2, there is 0.003ml 02/100ml • Therefore at 100mgHg (alveolar pO2), there is 0.3ml O2/100ml blood.
Oxygen flux = cardiac output x arterial oxygen content Oxygen flux = C.O. (1,39 Hb SaO2) + (0,003 PaO2) C.O. = cardiac output = stroke vol. X heart-rate where SV depends on preload, contractility and afterload Hb = haemaglobin SaO2 = saturation PaO2 = arterial partial pressure O2
The perfect lung – oxygen cascade showing V/Q Inequality Hypoxic mixture Hypoventilation Diffusion 20 15 10 5 0 kPa Shunt