Social Networks Visualization
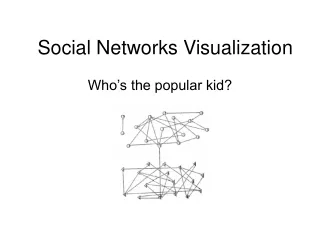
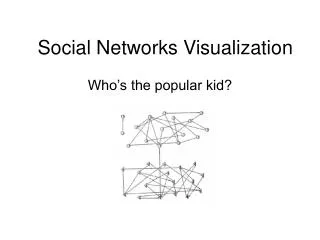
Social Networks Visualization. Who’s the popular kid?. Sociologists are looking for:. Social Groups - collections of actors closely linked to one another Social Positions – sets of actors who are linked to the social system in similar ways (note: “actors” = nodes).

Social Networks Visualization
E N D
Presentation Transcript
Social Networks Visualization Who’s the popular kid?
Sociologists are looking for: • Social Groups - collections of actors closely linked to one another • Social Positions – sets of actors who are linked to the social system in similar ways (note: “actors” = nodes)
Visualizations are a helpful tool when exploring social relationships in • business practices • social groups • tribal cultures • animal species • crime families
Social Networks Visualization Overview Visualizing Social Networks (Linton C. Freeman) Graph Layout Visualizing Social Groups (Linton C. Freeman) • Multidimensional Scaling • Factor Analysis (SVD) Your social network – an application Social Network Fragments (Danah Boyd) • Spring Models
Five Phases • 1930’s Hand drawn images • 1950’s Using computational procedures • 1970’s Machine drawn images • 1980’s Screen-oriented graphics • 1990’s The era of web browsers
1930’s Hand Drawn Images Jacob L. Moreno’s foundational work (1) Draw graphs - nodes represent actors, lines represent relations between actors
1930’s Hand Drawn Images Jacob L. Moreno’s foundational work (1) Draw graphs (2) Draw directed graphs Moreno (1932)
1930’s Hand Drawn Images Jacob L. Moreno’s foundational work (1) Draw graphs (2) Draw directed graphs (3) Use colours to draw “multigraphs” Moreno (1932)
1930’s Hand Drawn Images Jacob L. Moreno’s foundational work (1) Draw graphs (2) Draw directed graphs (3) Use colours (4) Vary shapes of nodes Moreno (1932)
1930’s Hand Drawn Images Jacob L. Moreno’s foundational work (1) Draw graphs (2) Draw directed graphs (3) Use colours (4) Vary shapes of nodes (5) Use location of nodes to stress different features of the data
1950’s Computational Methods The burning question: How do we lay out the points? Solutions: Factor analysis Multidimensional scaling
1950’s Computational Methods Factor analysis Reduce the number of points by mapping similar points into “factors”. Each successive factor represents less and less of the variability of the data.
1950’s Computational Methods Bock & Husain (1952) Clusters of 9th grade school children
1950’s Computational Methods Bock & Husain (1952) Clusters of 9th grade school children
1950’s Computational Methods Multidimensional Scaling (MDS) Arrange points in 2D or 3D in such a way that distances between pairs of points on the display correspond to distances between individuals in the data
1980’s Screen oriented graphics • Krackplot Krackplot image of Social Support Network of a Homeless Woman
1980’s Screen oriented graphics • Krackpot • NetVis Two-mode data on Women’s Attendance at Social Events
1990’s The era of web browsers • Java Programs
1990’s The era of web browsers • Java Programs • Virtual Reality Modeling Language (VRML)
Visualizing Social Networksby Linton C. Freeman • Strong Points: • A comprehensive overview • Many examples of visualizations with real data • Weak Points: • Short description of each system • Figures!!!
Visualizing Social Networksby Linton C. Freeman • Strong Points: • A comprehensive overview • Many examples of visualizations with real data • Weak Points: • Short description of each system • Figures!!! • Examples arranged chronologically, not by contribution • No evaluation
Social Networks Visualization Overview Visualizing Social Networks (Linton C. Freeman) Graph Layout Visualizing Social Groups (Linton C. Freeman) • Multidimensional Scaling • Factor Analysis (SVD) Your social network – an application Social Network Fragments (Danah Boyd) • Spring Embedder
Visualizing Social Groups We want to • uncover social groups • investigate roles/positions in the groups Social connections are either • Binary – individuals are either linked or not linked • Qualitative – individuals are relatively more or relatively less strongly linked
Laying out the Nodes Two methods • Multidimensional Scaling (MDS) • Factor Analysis (SVD)
Multidimensional Scaling (MDS) Need proximity data; relative distance between two points. Arrange points in 2D or 3D so that distances between pairs of points on the display correspond to distances between individuals in the data Spring Model to lay them out so that the ideal distance between nodes is their proximity. Nodes are laid out in random then “let go”.
Principal Components Analysis Another way to assign a location to the points Maps each node in the matrix of associations to a new vector (factor). Some nodes will have been collapsed to a single point Each new vector contains less and less of the variance of the original data.
Evaluation How do we decide which method is better? Two criteria: • Groups as specified in ethnographic reports • Groups based on formal specification of group properties
Ethnographic report Observer reports: • Workers are divided into two groups (W1, W2, W3, W4, S1, I1) (W6, W7, W8, W9, S4) • W5 was an outsider to both groups
Ethnographic report Observer reports: • Workers are divided into two groups (W1, W2, W3, W4, S1, I1) (W6, W7, W8, W9, S4) • W5 was an outsider to both groups • Groups had core and peripheral members W3 “leader”, W2 “marginal” W6 “not entirely accepted”, S4 “socially inferior”
Evaluation • Groups as specified in ethnographic reports • Both do well, MDS captures more subtle detail • Groups based on formal specification of group properties