Objective - To graph linear equations using x-y charts.
140 likes | 373 Views
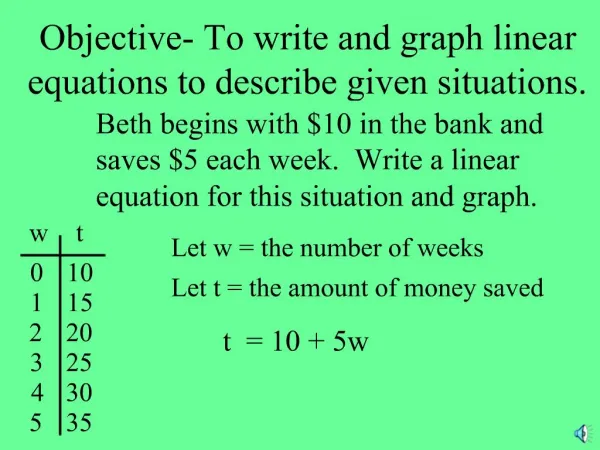
Objective - To graph linear equations using x-y charts. Two Variable Equations. One Variable Equations. 2x - 3 = 11. x + y = 5. +3 +3. Ordered Pairs (x,y). y. x. Solutions:. 2x = 14. 1 2 4 5 7. 4 3 1 0 -2. x = 1, y = 4. (1,4). 2 2. (2,3). x = 7. x = 2, y = 3.

Objective - To graph linear equations using x-y charts.
E N D
Presentation Transcript
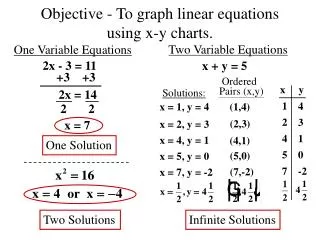
Objective - To graph linear equations using x-y charts. Two Variable Equations One Variable Equations 2x - 3 = 11 x + y = 5 +3 +3 Ordered Pairs (x,y) y x Solutions: 2x = 14 1 2 4 5 7 4 3 1 0 -2 x = 1, y = 4 (1,4) 2 2 (2,3) x = 7 x = 2, y = 3 x = 4, y = 1 (4,1) One Solution (5,0) x = 5, y = 0 (7,-2) x = 7, y = -2 Two Solutions Infinite Solutions
State whether the given point is a solution to 3x - y = 5. 1) (2, 1) 2) (4, 5) 3) (-3, -14) 4) 5) (-1, 2) Yes 3(2) - 1 = 5 No 3(4) - 5 = 5 Yes 3(-3) --14 = 5 Yes No 3(-1) - 2 = 5
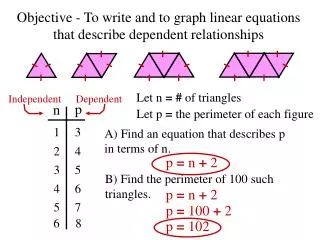
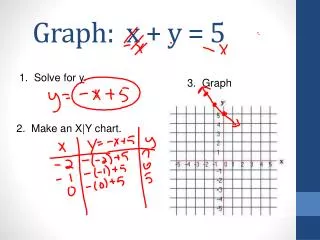
Complete the chart and graph. y y = 2x - 3 x y -3 -2 -1 0 1 2 3 2(-3) - 3 = -9 2(-2) - 3 = -7 -5 x -3 -1 1 3
Complete the chart and graph. y y = 2x - 3 x y -3 -2 -1 0 1 2 3 2(-3) - 3 = -9 2(-2) - 3 = -7 -5 x -3 -1 1 3
Complete the chart and graph. y y = 2x - 3 x y -3 -2 -1 0 1 2 3 2(-3) - 3 = -9 2(-2) - 3 = -7 -5 x -3 -1 1 3
Complete the chart and graph. y y = 2x - 3 x y -3 -2 -1 0 1 2 3 2(-3) - 3 = -9 2(-2) - 3 = -7 -5 x -3 -1 1 3
Complete the chart and graph. y y = 2x - 3 x y -3 -2 -1 0 1 2 3 2(-3) - 3 = -9 2(-2) - 3 = -7 -5 x -3 -1 1 3
Complete the chart and graph. y y = 2x - 3 x y -3 -2 -1 0 1 2 3 2(-3) - 3 = -9 2(-2) - 3 = -7 -5 x -3 -1 1 3 This line represents all real solutions to y = 2x - 3.
Solve the following equations for y. (Function Form) 2) -x + 2y =-4 1) 2x + y = 5 +x +x -2x -2x 2y = x - 4 y =-2x + 5 2 2
Rewrite the equation in function form. 4) -2x + 3y =-6 3) 3x + 5y = 10 -3x -3x +2x +2x 5y =-3x + 10 3y = 2x - 6 5 5 3 3
Solve the equation for y, complete the chart, and graph. 1) 3x + 2y = 4 -3x -3x y x y 2y =-3x + 4 -4 -2 0 2 4 6 8 2 2 5 2 x -1 -4 -7
Rewrite in function form, complete the chart, and graph. 2) x - 3y = 6 -x -x y x y -3y =-x + 6 -6 -3 0 3 6 9 -4 -3 -3 -3 -2 x -1 0 1
Solve the equation for y, find at least five solutions, and graph. 3) x + 2y = 8 y -x -x x y 2y =-x + 8 -4 -2 0 2 4 6 6 2 2 5 4 x 3 2 1