Download
1 / 9
90 likes | 115 Views
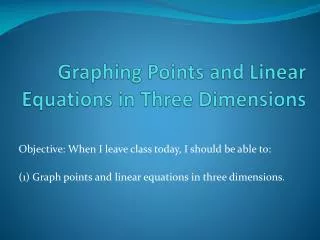
Learn to graph points and linear equations in three-dimensional space using ordered triples in the coordinate system. Understand how to represent points and graph planes in 3D.

E N D
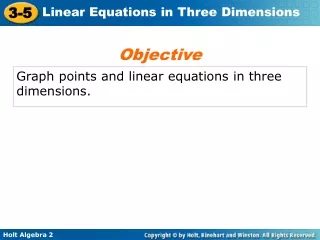
Objective Graph points and linear equations in three dimensions.
Vocabulary three-dimensional coordinate system ordered triple z-axis
Each point in coordinate space can be represented by an ordered triple of the form (x, y, z). The system is similar to the coordinate plane but has an additional coordinate based on the z-axis. Notice that the axes form three planes that intersect at the origin.
z y x Example 1A: Graphing Points in Three Dimensions Graph the point in three-dimensional space. A(3, –2, 1) From the origin, move 3 units forward along the x-axis, 2 units left, and 1 unit up. A(3, –2, 1)
z y x Example 1B: Graphing Points in Three Dimensions Graph the point in three-dimensional space. B(2, –1, –3) From the origin, move 2 units forward along the x-axis, 1 unit left, and 3 units down. B(2, –1, –3)
z y x Example 1C: Graphing Points in Three Dimensions Graph the point in three-dimensional space. C(–1, 0, 2) C(–1,0, 2) From the origin, move 1 unit back along the x-axis, 2 units up. Notice that this point lies in the xz-plane because the y-coordinate is 0.
Recall that the graph of a linear equation in two dimensions is a straight line. In three-dimensional space, the graph of a linear equation is a plane. Because a plane is defined by three points, you can graph linear equations in three dimensions by finding the three intercepts.
Example 2: Graphing Linear Equations in Three Dimensions Graph the linear equation 2x – 3y + z = –6 in three-dimensional space. Step 1 Find the intercepts: x-intercept: 2x – 3(0) + (0) = –6 x = –3 y-intercept: 2(0) – 3y + (0) = –6 y = 2 z-intercept: 2(0) – 3(0) + z = –6 z = –6
z y x Example 2 Continued Step 2 Plot the points (–3, 0, 0), (0, 2, 0), and (0, 0, –6). Sketch a plane through the three points. (–3, 0, 0) (0, 2, 0) (0, 0, –6)