Download

1 / 10
100 likes | 124 Views
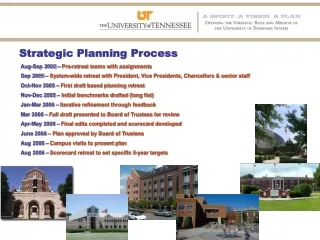
This strategic planning process timeline outlines the steps taken to improve education in Tennessee, focusing on increasing college degrees and graduation rates. It covers pre-retreat team assignments, drafting benchmarks, refining through feedback, and final approval by the Board of Trustees. The plan aims to bridge the education gap with national averages and set specific 5-year targets through a comprehensive approach.

E N D
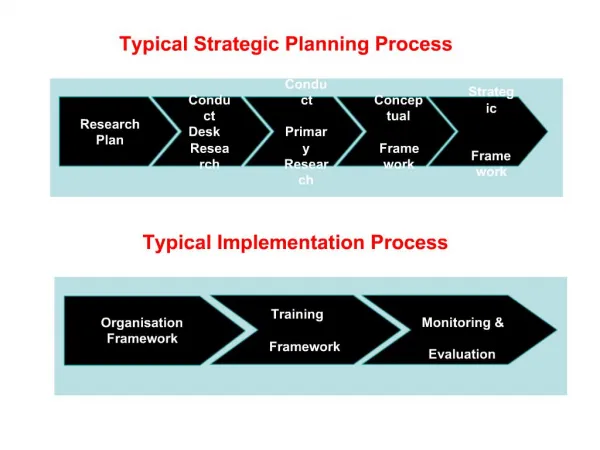
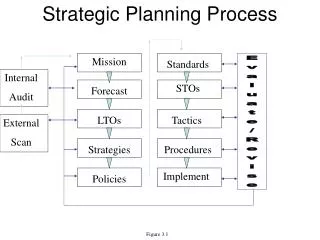
Strategic Planning Process Aug-Sep 2005– Pre-retreat teams with assignments Sep 2005 – System-wide retreat with President, Vice Presidents, Chancellors & senior staff Oct-Nov 2005– First draft based planning retreat Nov-Dec 2005– Initial benchmarks drafted (long list) Jan-Mar 2006 – Iterative refinement through feedback Mar 2006 – Full draft presented to Board of Trustees for review Apr-May 2006 – Final edits completed and scorecard developed June 2006 – Plan approved by Board of Trustees Aug 2006 – Campus visits to present plan Aug 2006 – Scorecard retreat to set specific 5-year targets
Education in Tennessee: Better Education = Better Jobs = Better Pay Average Pay in Tennessee $14,000 difference per year High School vs. College U.S. Census Bureau 1998 to 2001
40 TN US 30 26.5 21.4 20 10 0 Iowa Ohio Utah Idaho Nation Maine Texas Illinois Alaska Florida Hawaii Indiana Kansas Oregon Arizona Virginia Nevada Georgia Missouri Vermont Montana Alabama Michigan Kentucky Colorado Arkansas Maryland Wyoming Louisiana Delaware California Nebraska New York Oklahoma Tennessee Minnesota Wisconsin Mississippi Washington Connecticut New Jersey New Mexico Rhode Island North Dakota Pennsylvania West Virginia South Dakota North Carolina South Carolina Massachusetts New Hampshire Education in Tennessee:Tennessee is 5% below the national average in percentage of adults with a 4-yr college degree. Percentage US Census 2000
19 .2% to 44 .4% 12 .0% to 19 .2% 9 .0% to 12 .0% 7 .1% to 9 .0% 5 .4% to 7 .1% Education in Tennessee: Tennessee Lags in Percentage of Adults with CollegeDegrees Counties Below State Average Percent of Adult Population with at least a Baccalaureate Degree, 2000
Graduation rate must improve in Tennessee The Student Pipeline—Tennessee
Mission focused strategic plan • Student Access and Student Success • Research and Economic Development • Outreach and Globalization
Mission focused strategic plan • Student Access and Student Success
Mission focused strategic plan • Research and Economic Development
Mission focused strategic plan • Outreach and Globalization