Download
1 / 17
170 likes | 274 Views
ECONOMIC DEVELOPMENT BENEFITS OF THE OIL AND GAS INDUSTRY IN NEWFOUNDLAND AND LABRADOR CONFERENCE. ST JOHN’S NEWFOUNDLAND 16 MAY 2007. LOCAL ECONOMIC BENEFITS OF THE OFFSHORE OIL AND GAS INDUSTRY IN SCOTLAND AND NORWAY. by TONY MACKAY. ANNUAL OIL PRODUCTION (million tonnes).

E N D
ECONOMIC DEVELOPMENT BENEFITSOF THE OIL AND GAS INDUSTRYIN NEWFOUNDLAND AND LABRADORCONFERENCE ST JOHN’S NEWFOUNDLAND 16 MAY 2007
LOCAL ECONOMIC BENEFITSOF THE OFFSHOREOIL AND GAS INDUSTRYIN SCOTLAND AND NORWAY by TONY MACKAY
OFFSHORE EXPENDITURE IN 2005(C$ million) • Newfoundland 1,345 • Norway 24,600 • UK 20,785
INDUSTRY COMPARISONS • Norwegian oil and gas production 15 xNewfoundland • UK oil and gas production 12 x Newfoundland • 300 producing fields offshore UK • 54 producing fields offshore Norway • 3 producing fields offshore Newfoundland • Norwegian offshore expenditure 18 x Newfoundland • UK offshore expenditure 15 x Newfoundland
KEY FEATURES IN SCOTLAND • 35 years of activity, with fluctuations • 1100+ companies involved as main activity, plus many otheres • Currently 75,000 oil and gas jobs in Scotland, including 30,000 offshore • Gas industry becoming more important • Tax revenues go to UK rather than Scotland
GEOGRAPHICAL DISTRIBUTION OF BENEFITS IN SCOTLAND • Most activity and employment concentrated in the Aberdeen area • Increasing concentration in Aberdeen following closure of platform fabrication yards • Increasing concentration following oil price collapse in 1990s….economies of scale and proximity • Other significant areas include • Shetland … Sullom Voe oil terminal and Lerwick supply base • Orkney … Flotta oil terminal • Cromarty Firth … Rig IRM base and Nigg oil terminal • Fife … Mossmorran NGL plant
COPING WITH DECLINE • Diversification into other offshore markets, eg • Norway - Gulf of Mexico • West Africa - Caspian Sea • Diversification into other energy markets, eg • wind farms, onshore and offshore • marine/wave/tidal energy • Supply of labour to other offshore markets • Offshore decommissioning market • Average company turnover now 68% UK and 32% international, with latter increasing
THE SHETLAND EXAMPLE • Close-knit community, comparable with Newfoundland and Labrador • Very active local authority .. Shetland Islands Council • Support from Shetland Enterprise, part of the Highlands and Islands Enterprise network • Oil revenues/taxes from throughput at Sullom Voe terminal • Re-investment in other local industries • salmon farming - information technology • fish processing - tourism • Investment in infrastructure • airports - ferry terminals • higher education facilities
KEY FEATURES IN NORWAY • History and scale similar with UK/Scotland but more stable and with smaller fluctuations because of gov policies • More protectionist policies than in UK have increased national and local benefits • State companies Statoil and Norsk Hydro dominate production and expenditure • Benefits spread more widely because of country’s geography
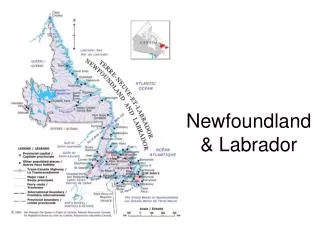
GEOGRAPHICAL DISTRIBUTION OF BENEFITS IN NORWAY • Three distinct areas - North Sea in the south - Norwegian Sea in the middle - Barents Sea in far north • North Sea - Stavanger main oil centre in country - Karsto, Mongstad, Kollnes terminals - Various fabrication yards in region
NORWAY BENEFITS (2) • Norwegian Sea - Kristiansund main base - Nyhamna and Tjeldbergodden terminals - Best examples for Newfoundland • Barents Sea - Hammerfest main base - Snohvit LNG development - Best examples for Labrador, partic gas